
Marketing That Pays For Itself.
Every program we run at America's Best Restaurants is designed to fund itself — the database you build pays for the marketing that builds it. Below, 18 independent restaurants proving it, grouped by how long they've been running the system.
We help independent restaurant owners WIN
In these case studies, you'll see how they WIN three ways.
WIN new customers
Paid-ad offers bring first-time guests through the door. Across the portfolio, 45% of every dollar of tracked sales comes from brand-new customers.
WIN back lost customers
Automated re-engagement campaigns pull back guests who haven't visited. 33% of tracked sales comes from lapsed customers getting another chance to spend.
WIN contact data from frequent customers
Every guest opts in — email, phone, birthday. 86,000+ owned customer records captured across the 18 restaurants in this portfolio. That database is yours forever.
Across 18 Independent Restaurants
Every restaurant starts somewhere
See results at every stage. Pick yours.
We grouped the 18 case studies by how long each restaurant has been running the system. Just starting? Look at Level 1. Been at it a year? Level 3. Multi-year veteran? Level 4. Click any card for the full story.
Showing 18 of 18 case studies
Early Wins
First 3 months — see what the first 90 days look like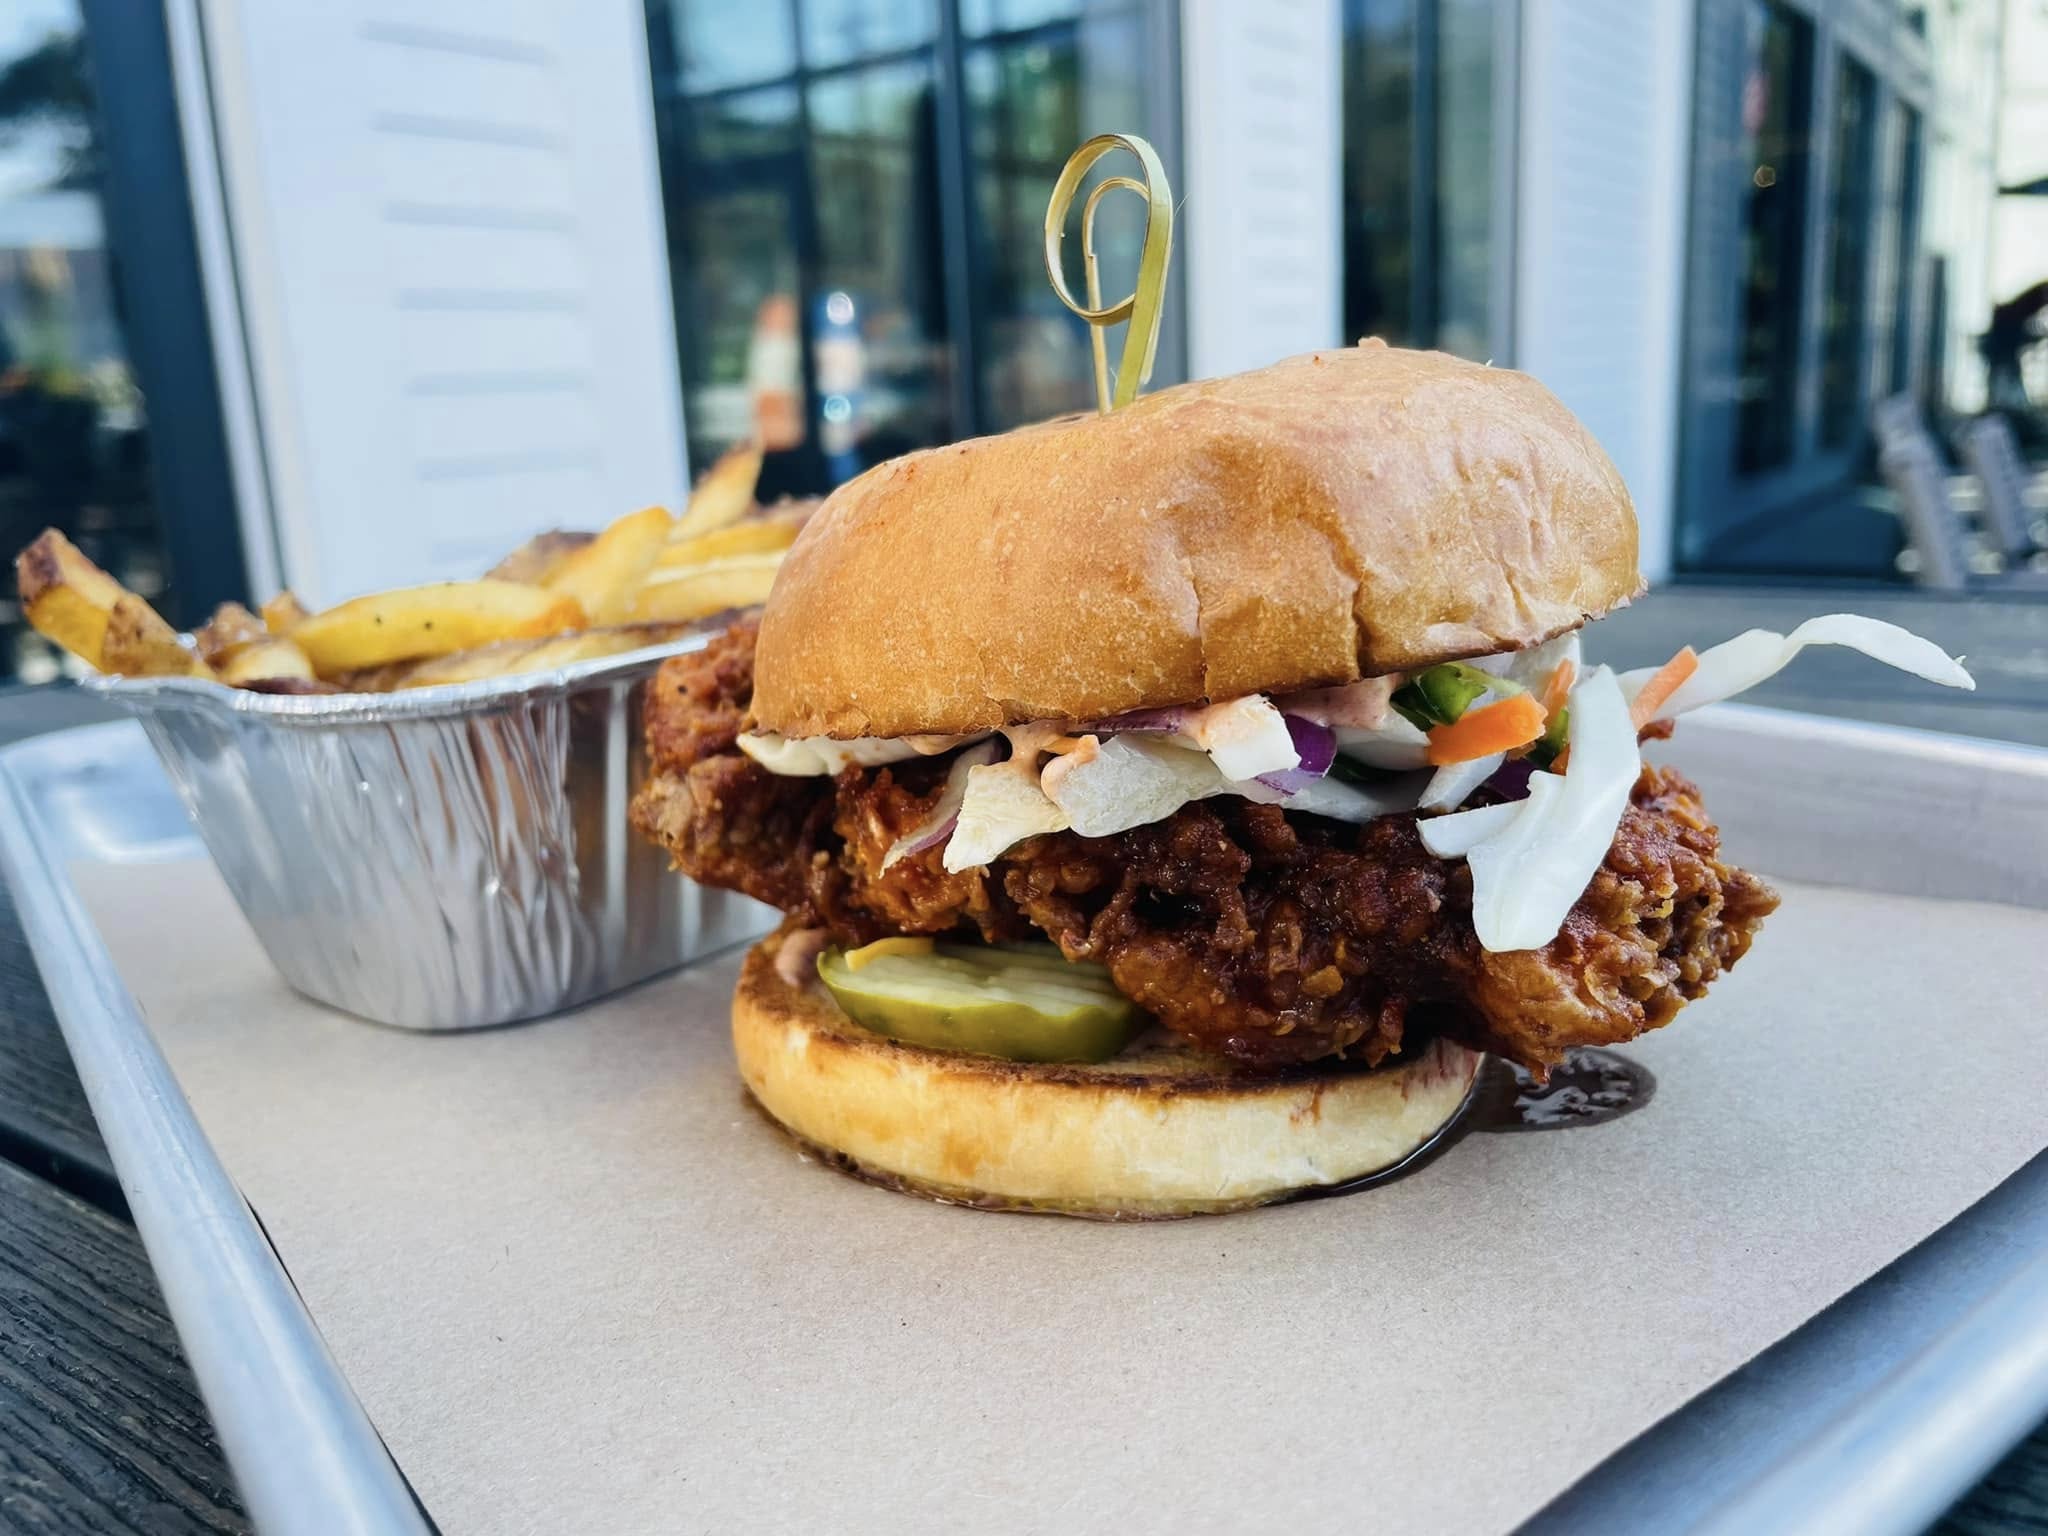 Fried Chicken
2 Location Chicken Sandwich Shop
Southern California · 1.6 months live
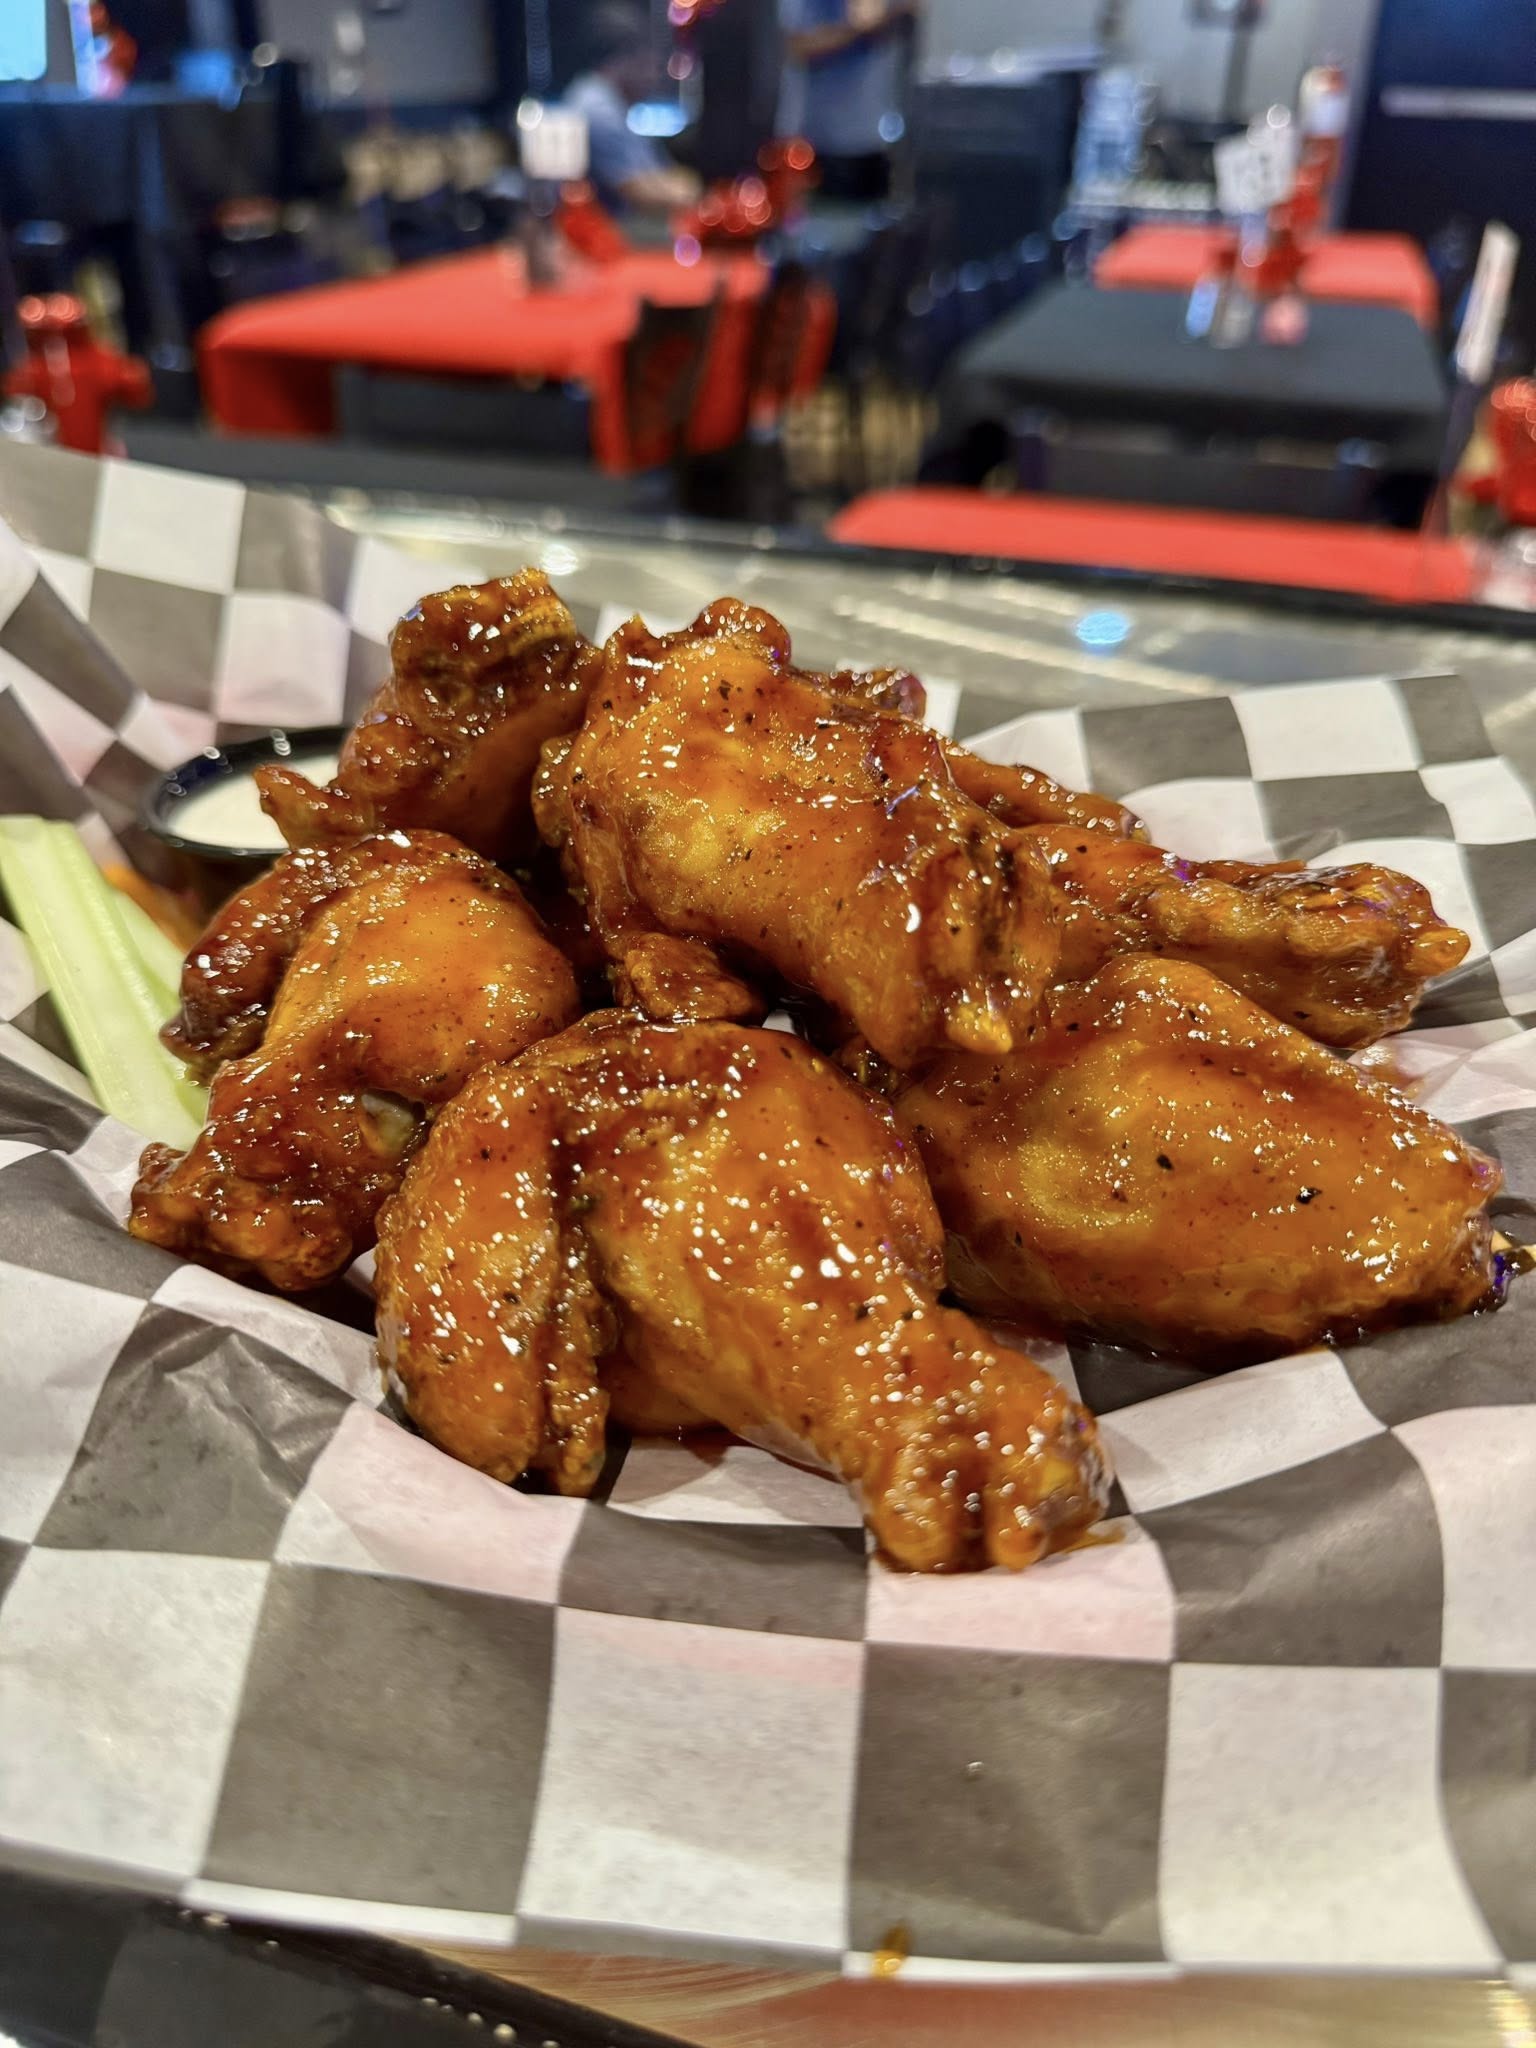 Bar & Grill
1 Location Tavern
Ozarks, AR · 3.1 months live
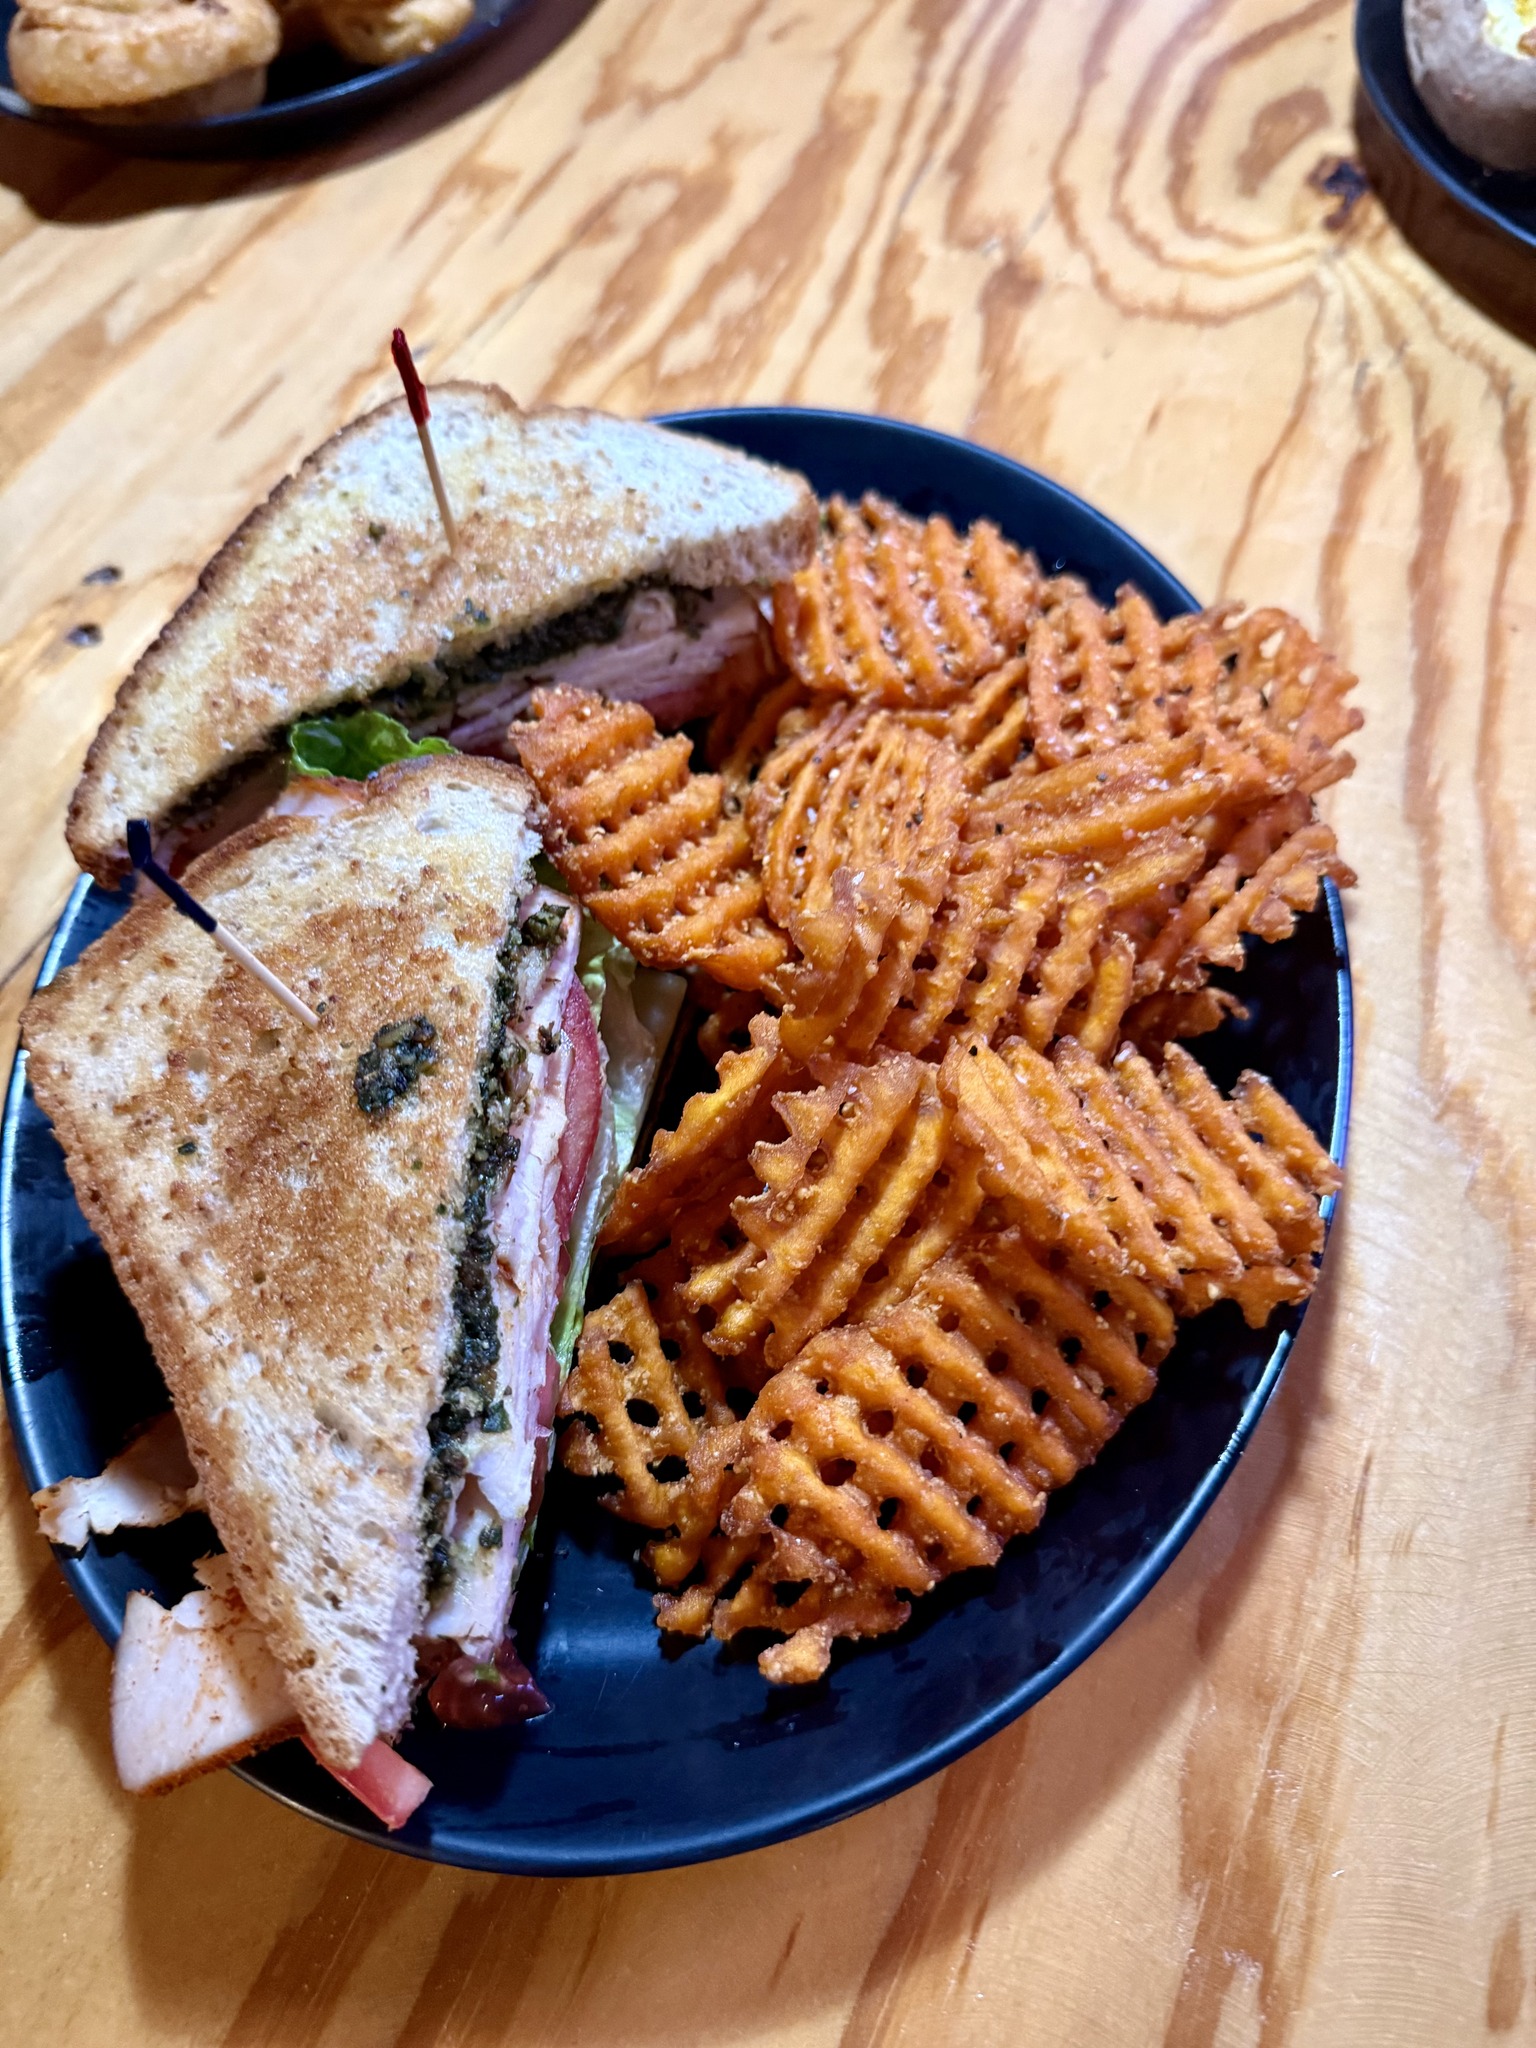 Cafe / Market
2 Location Cafe & Market
San Gabriel Valley, CA · 3.5 months live
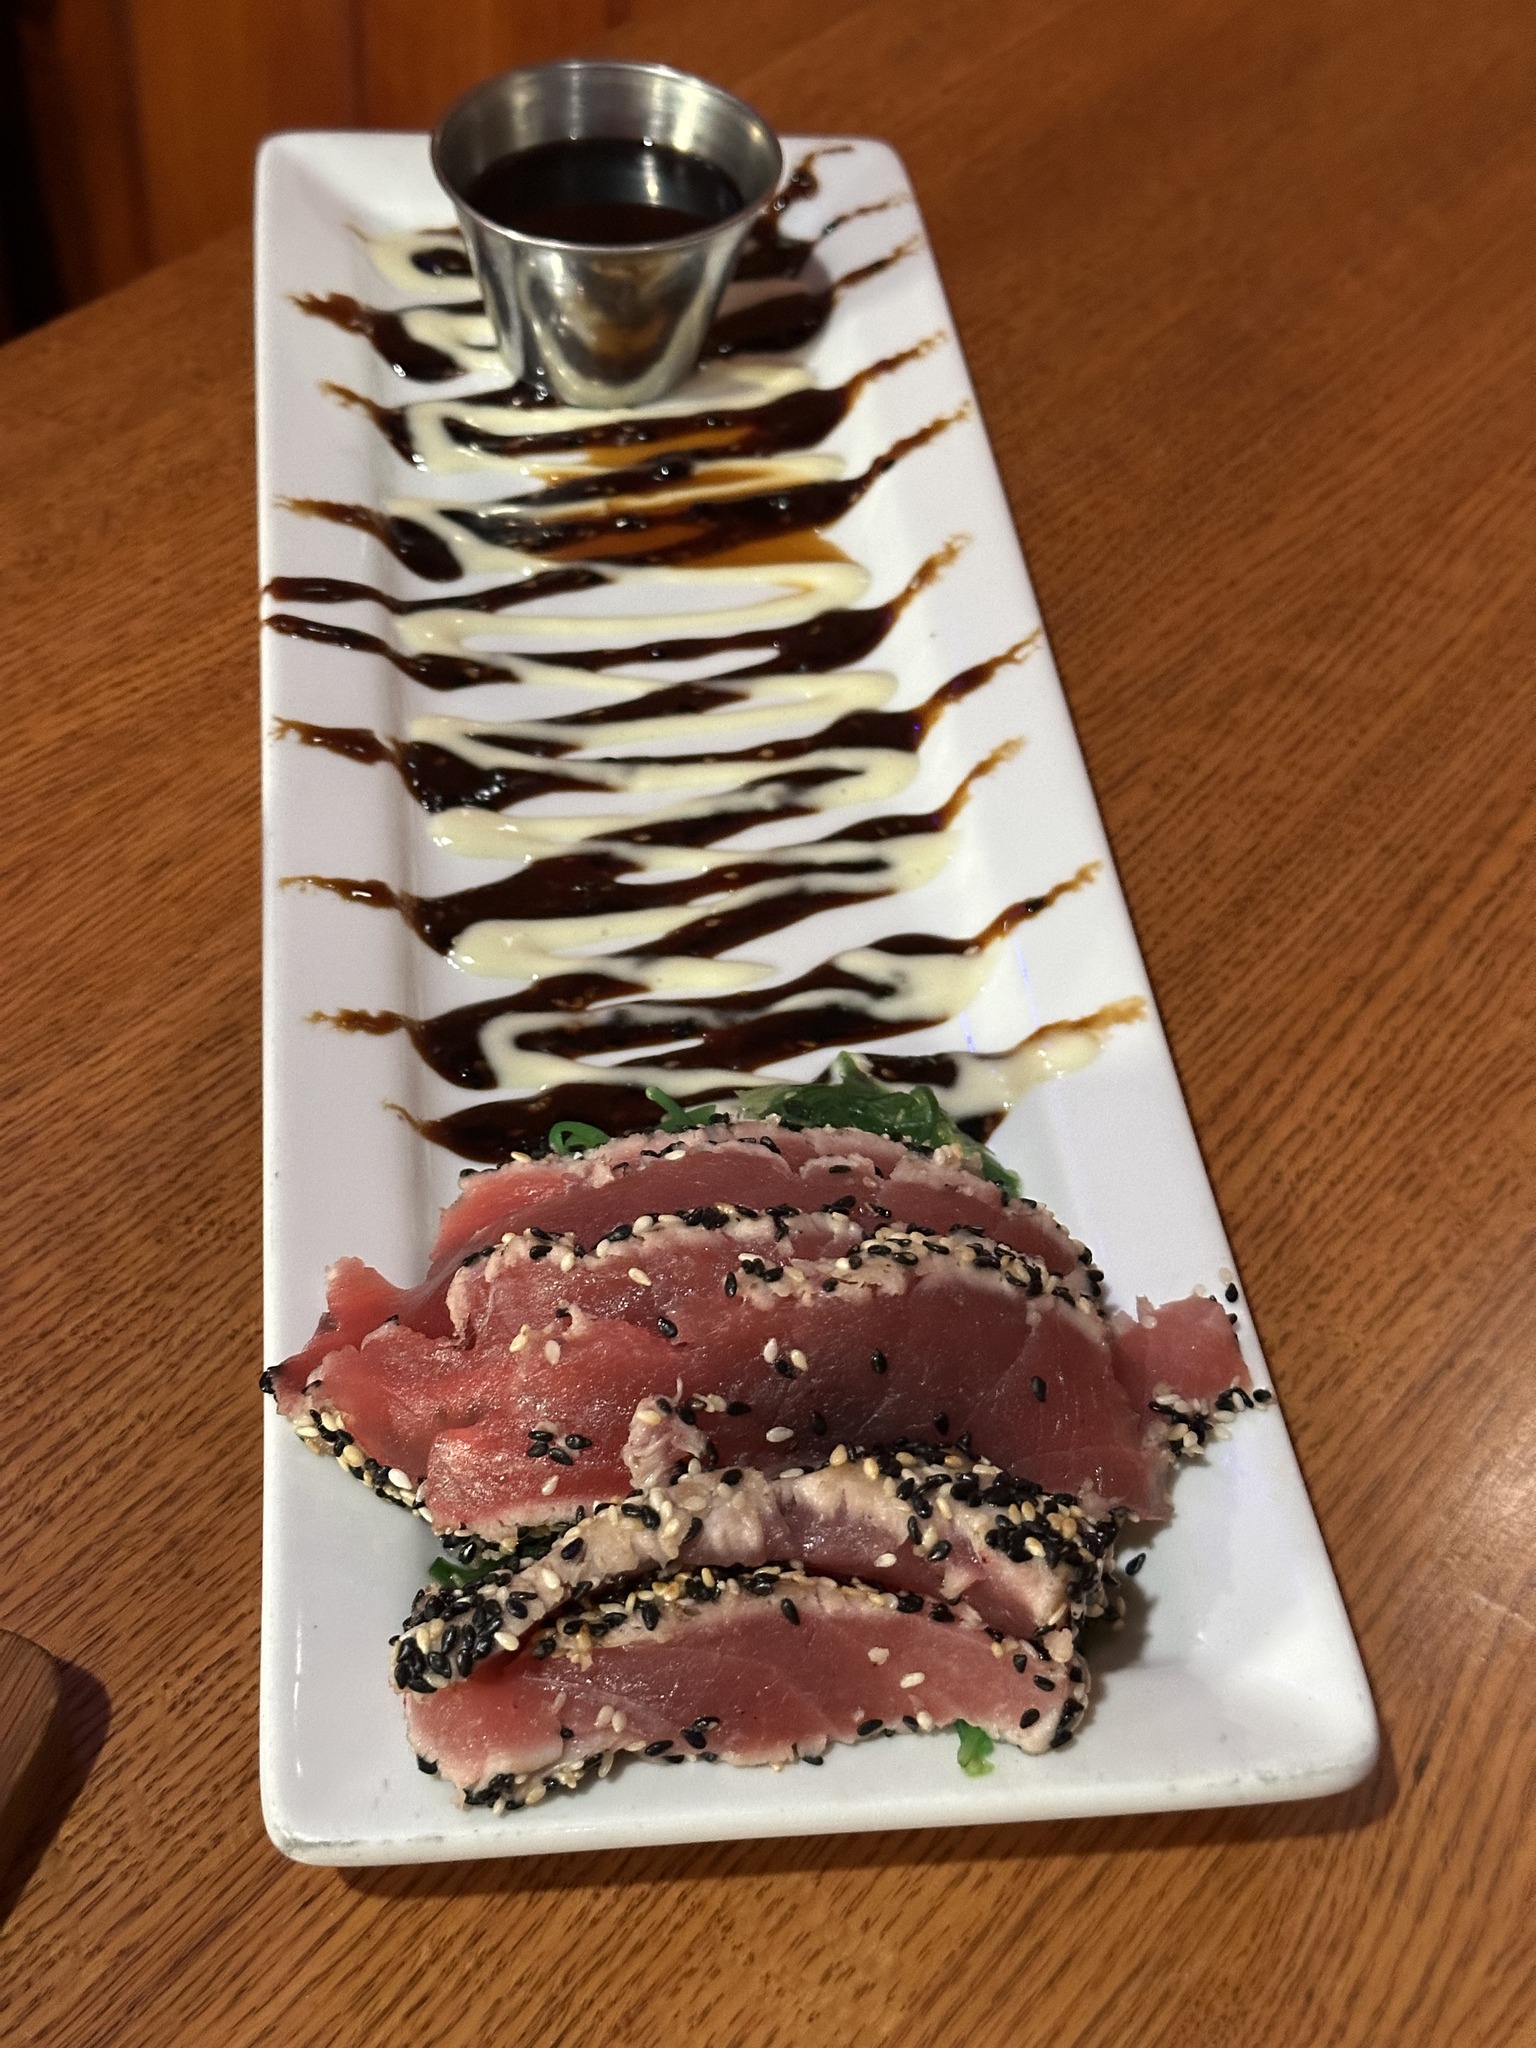 Seafood / Sushi
1 Location Sushi Restaurant
Suburban Reading, PA · 3.5 months live
Building Momentum
3-6 months — the system is working, database is compounding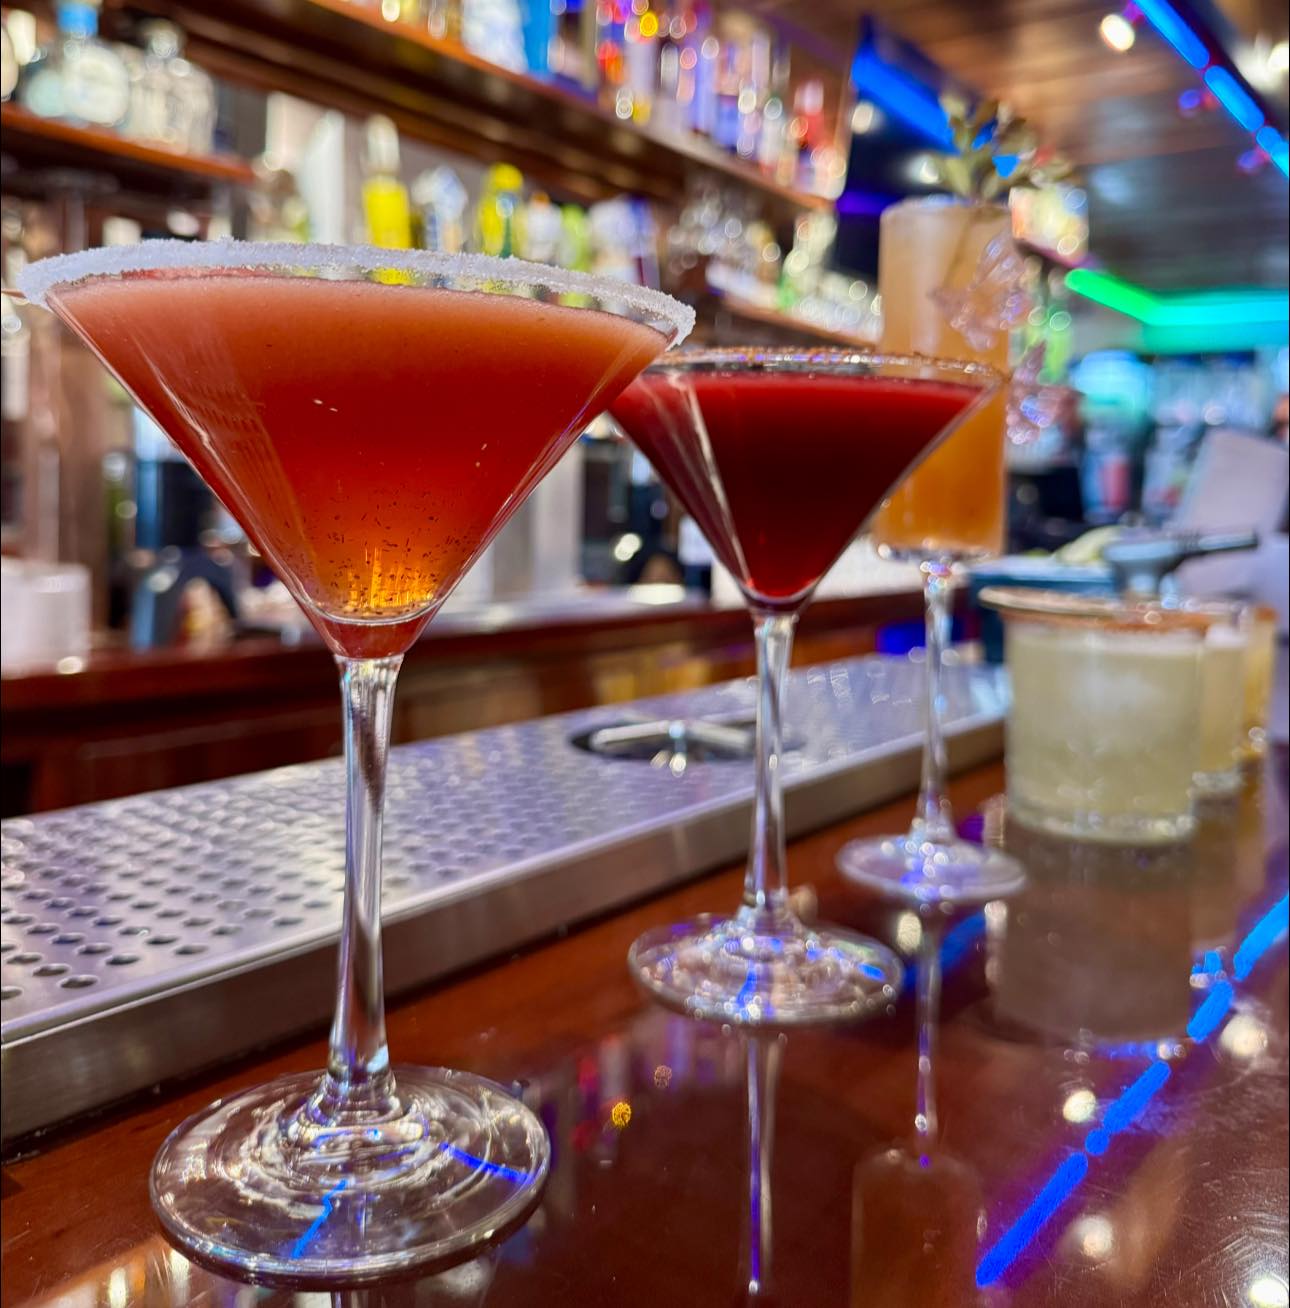 Mexican
1 Location Mexican Kitchen
Denver, CO · 4 months live
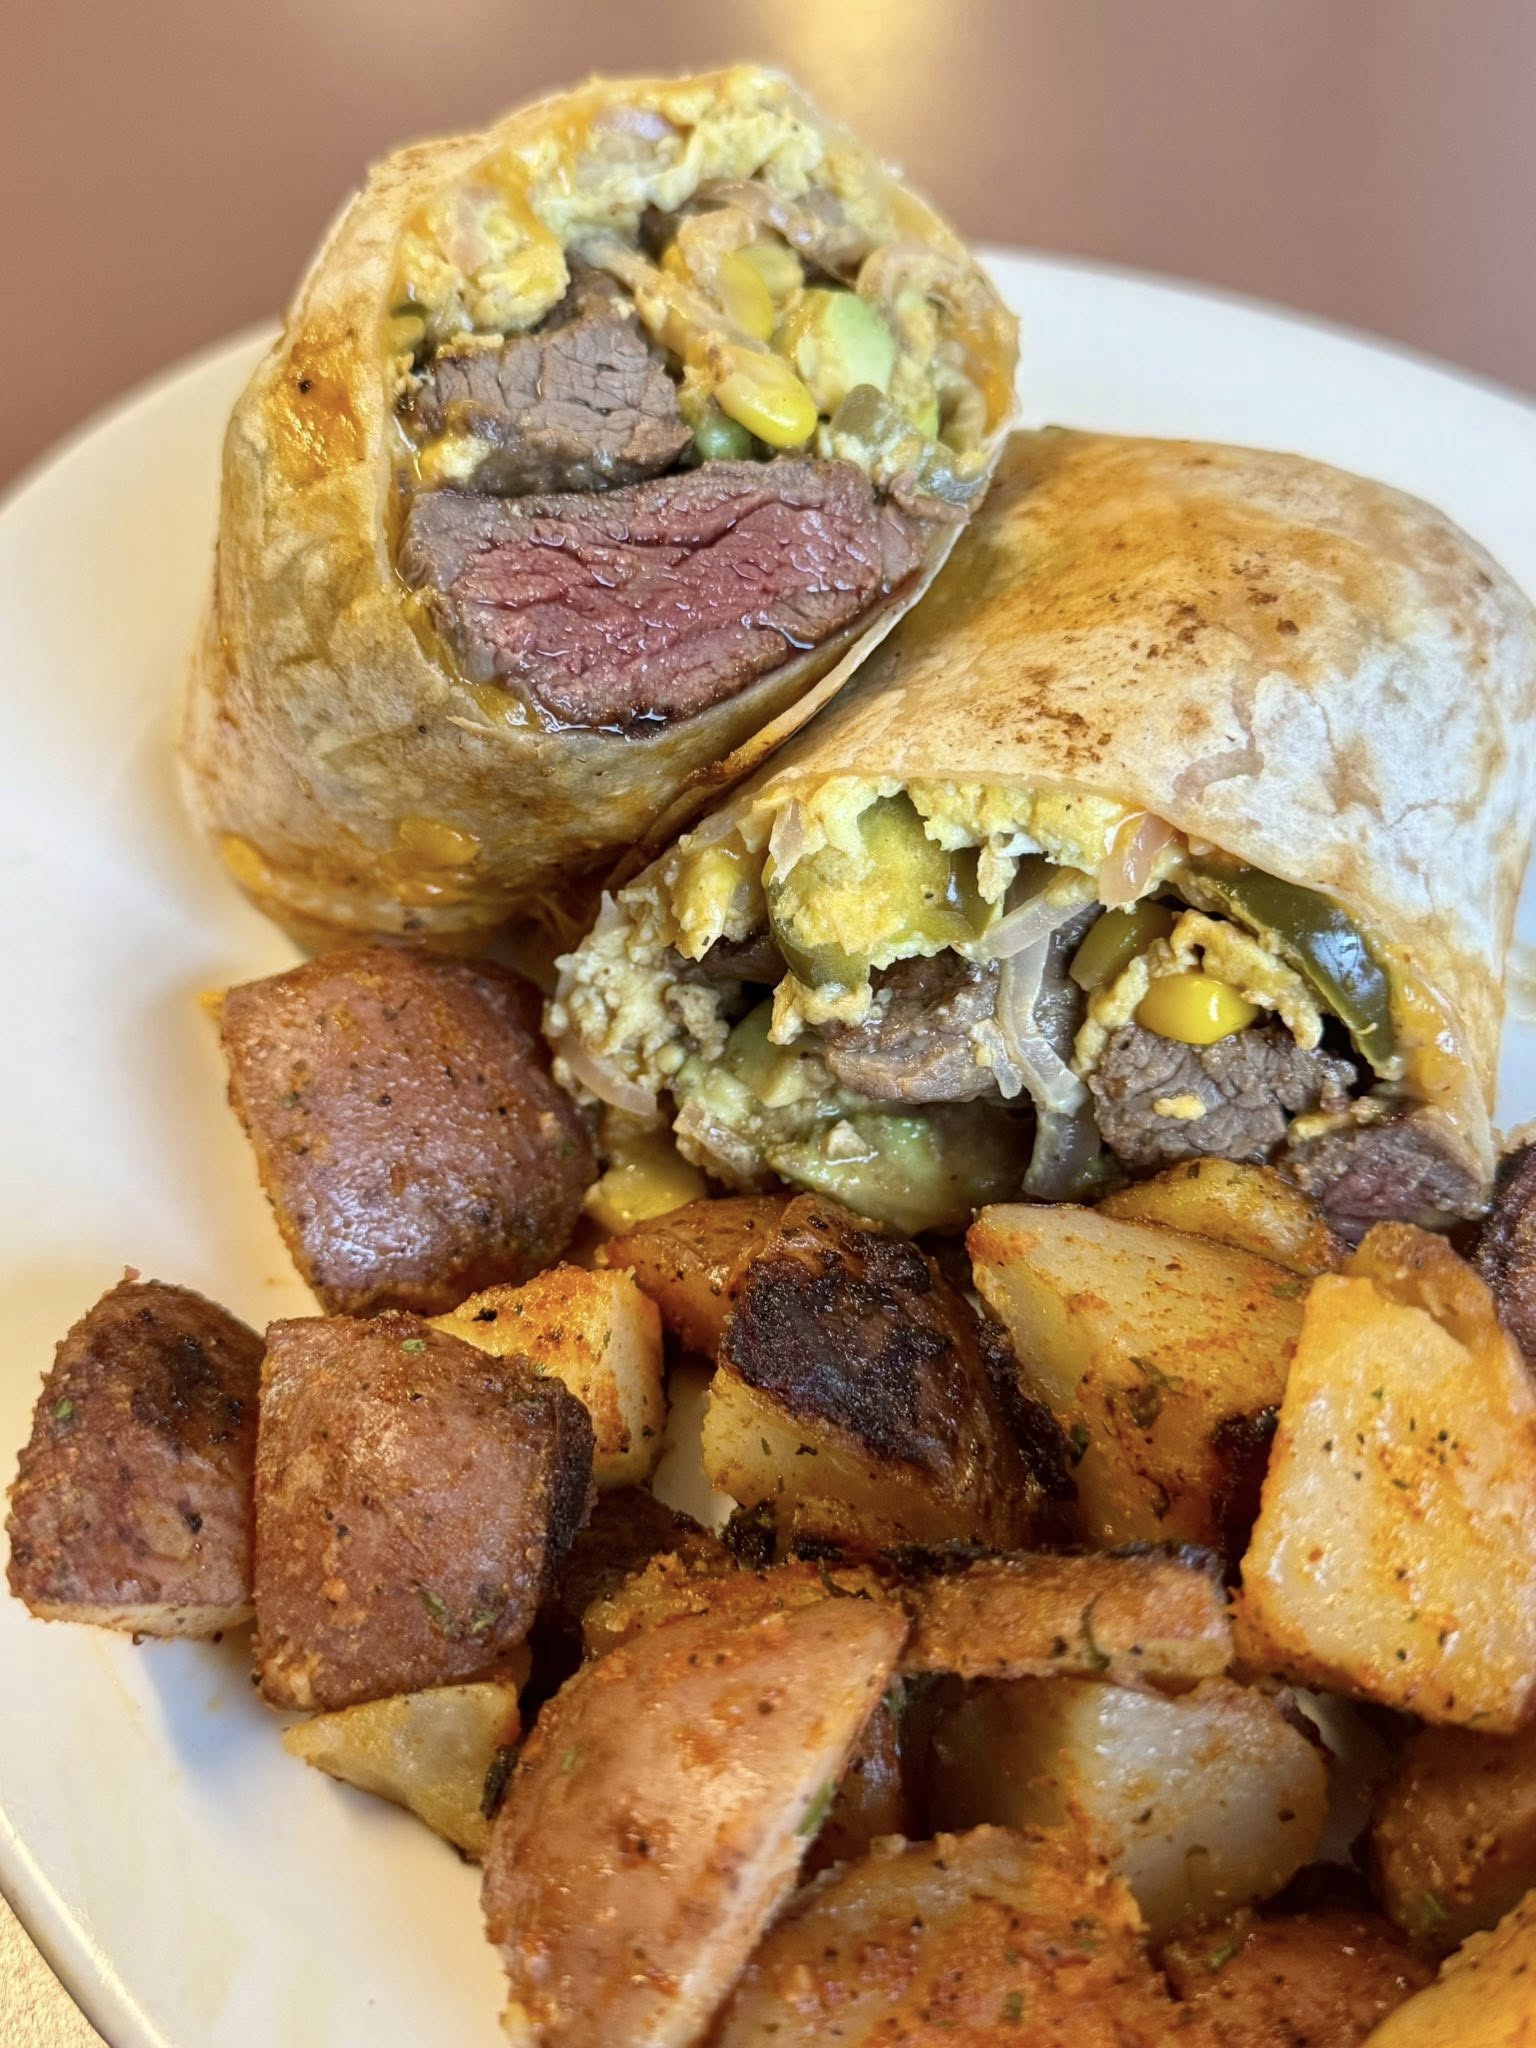 Diner / Breakfast
1 Location Breakfast Diner
La Crosse, WI · 4.2 months live
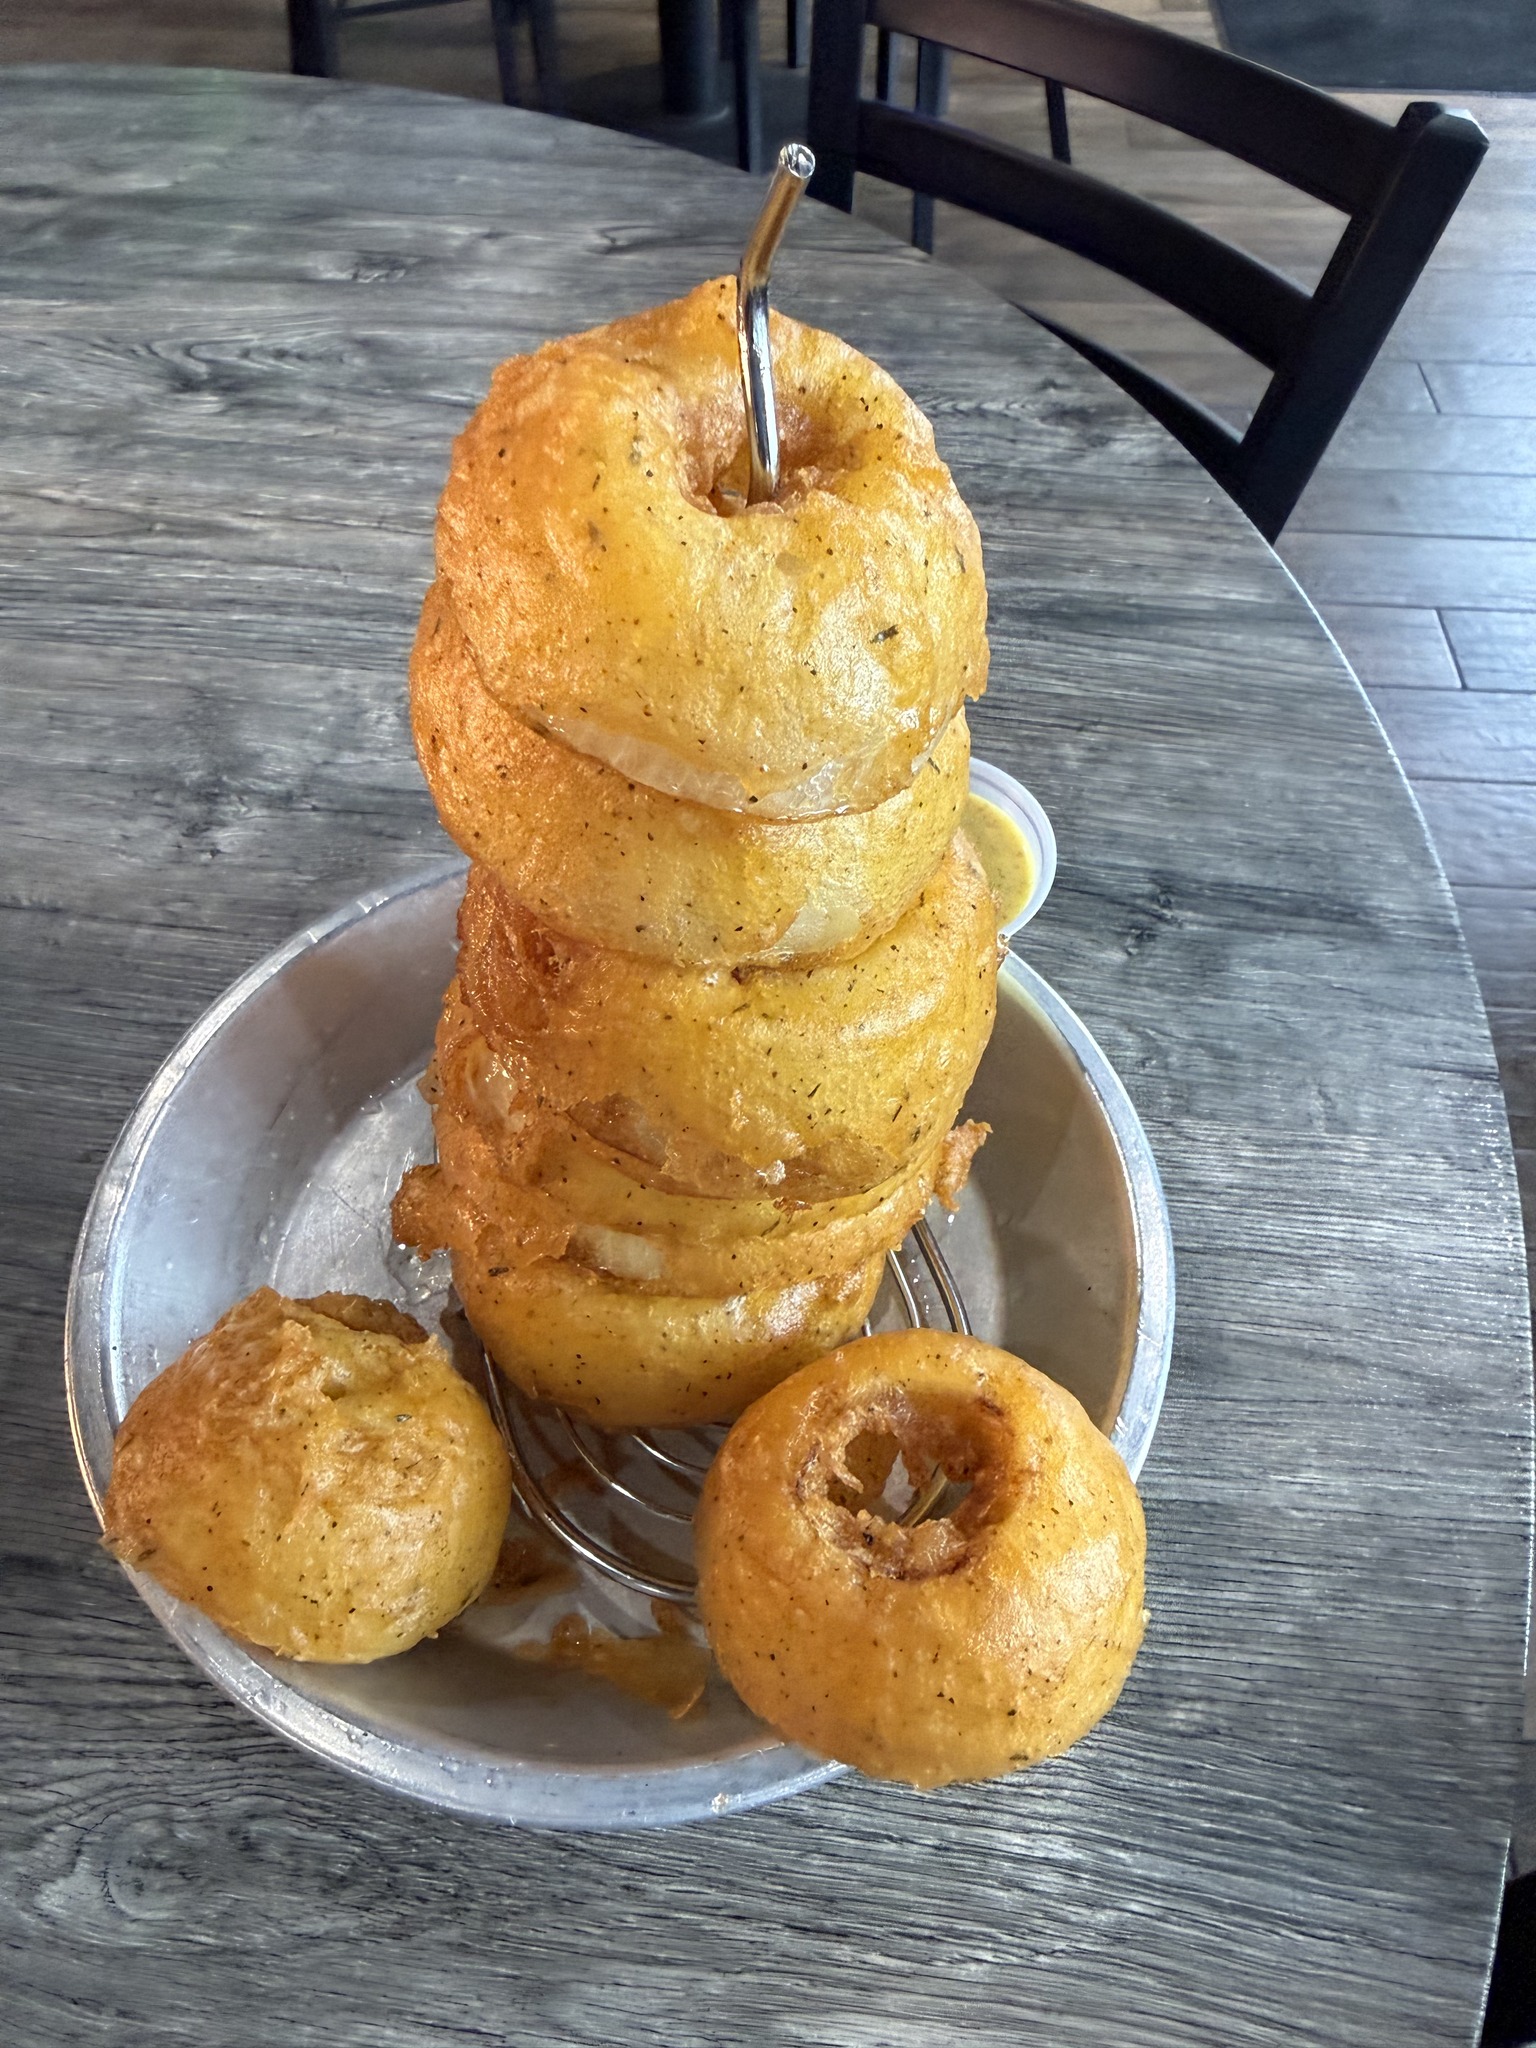 Mexican
1 Location Cantina
South Texas · 4.3 months live
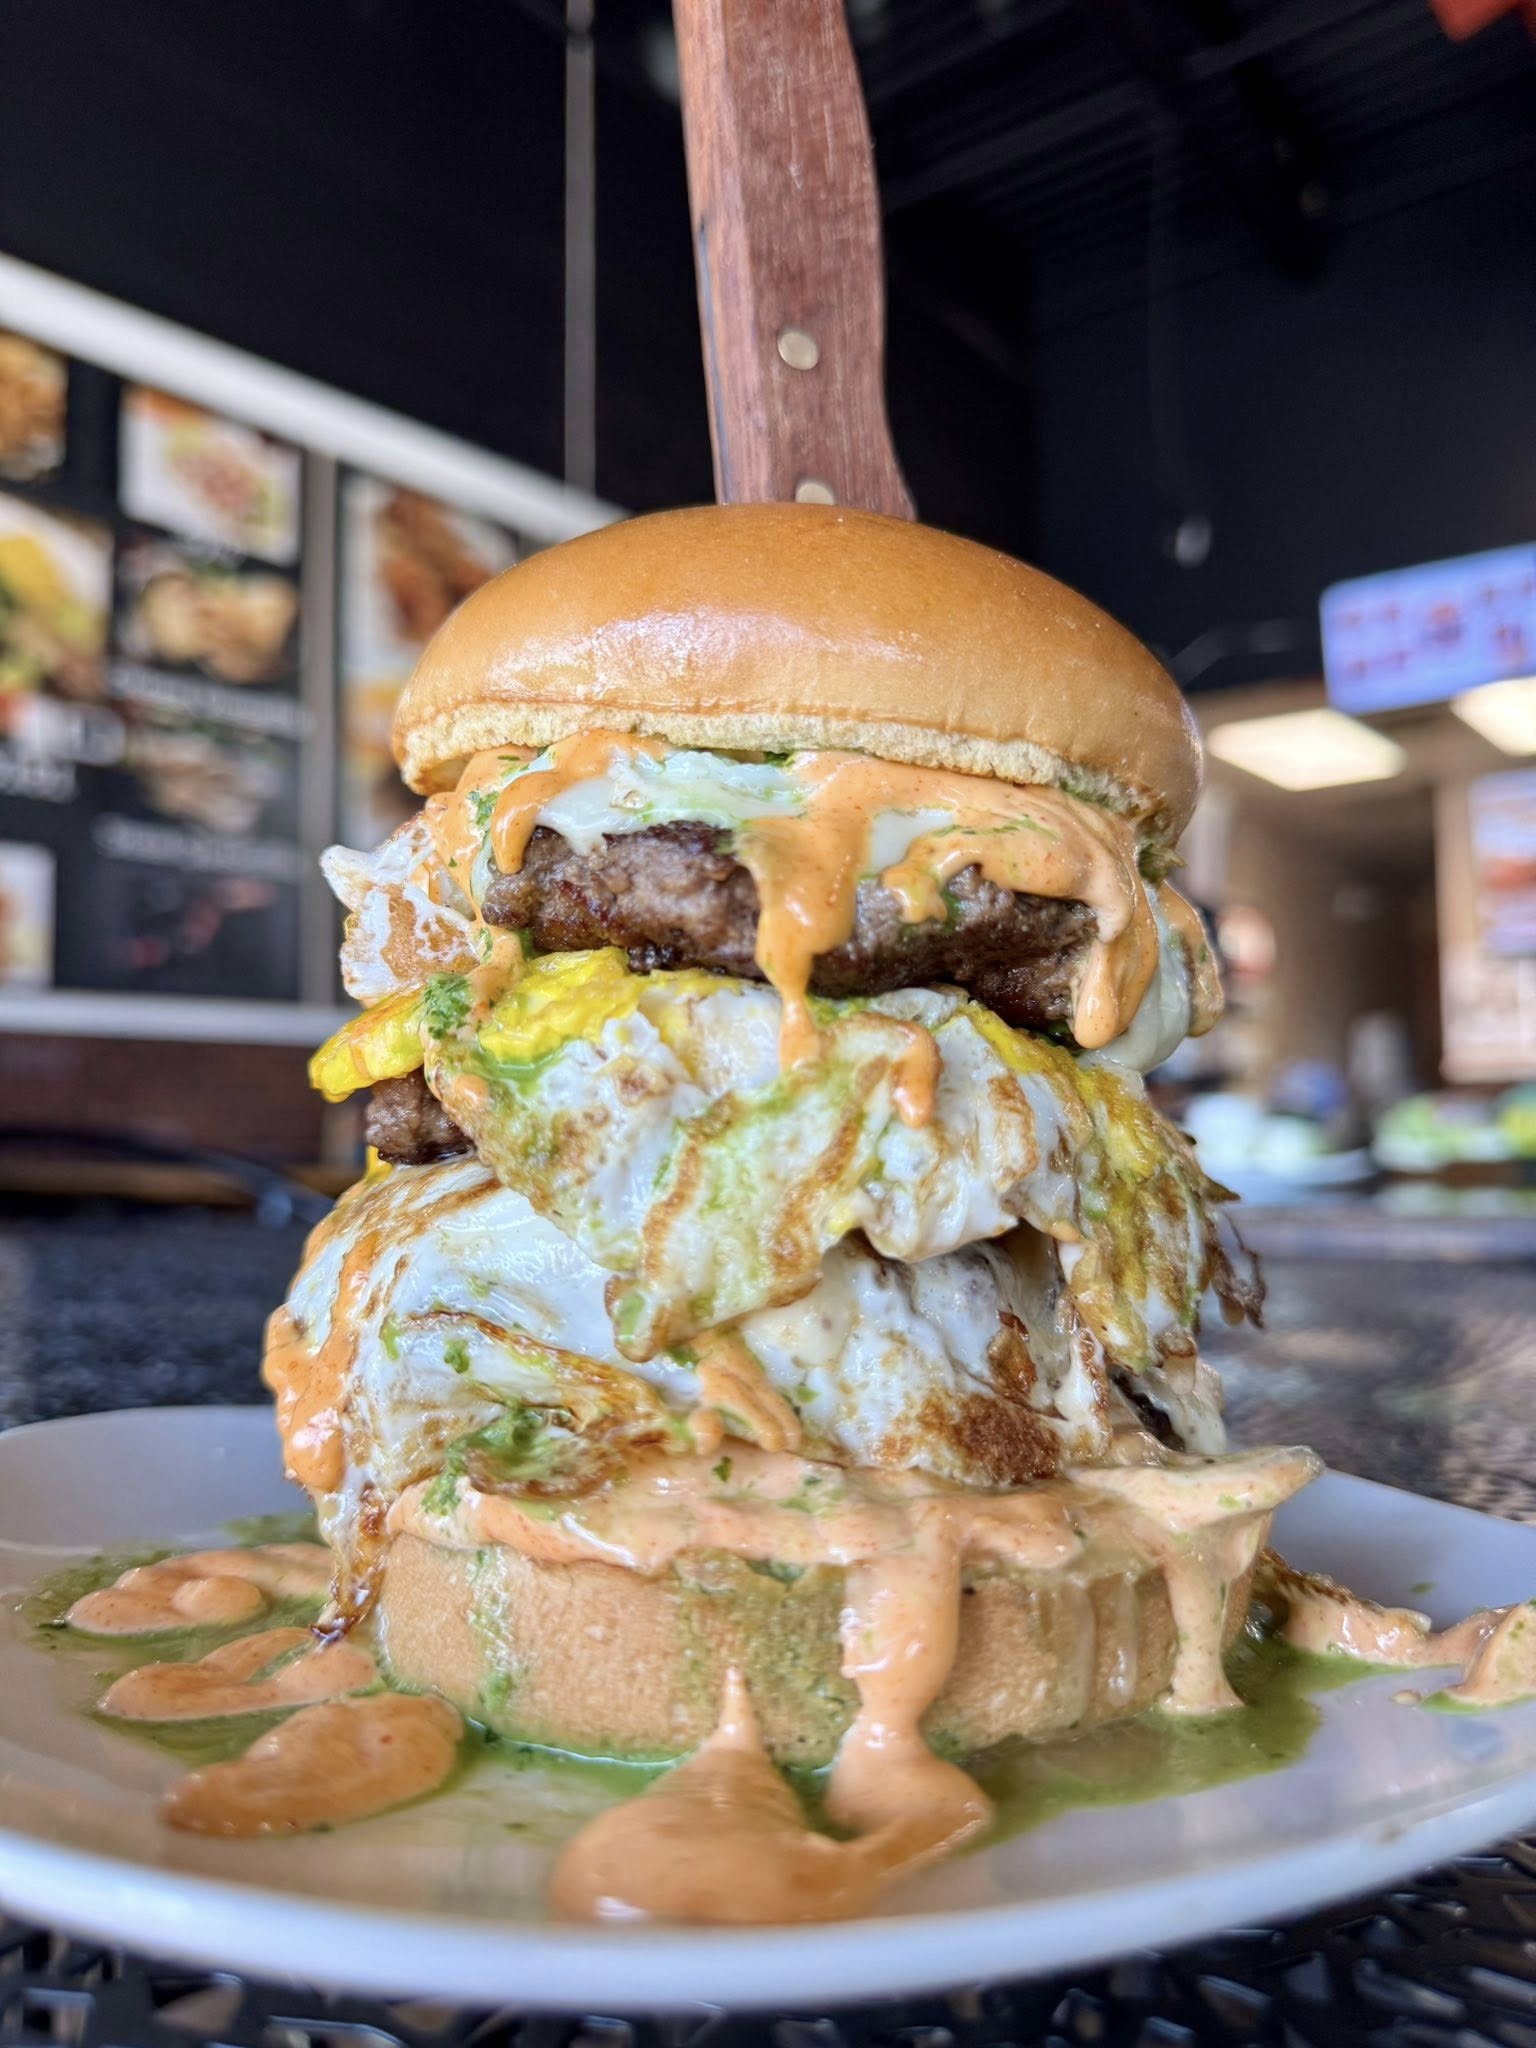 Bar & Grill
1 Location Burger Pub
South Jersey, NJ · 5 months live
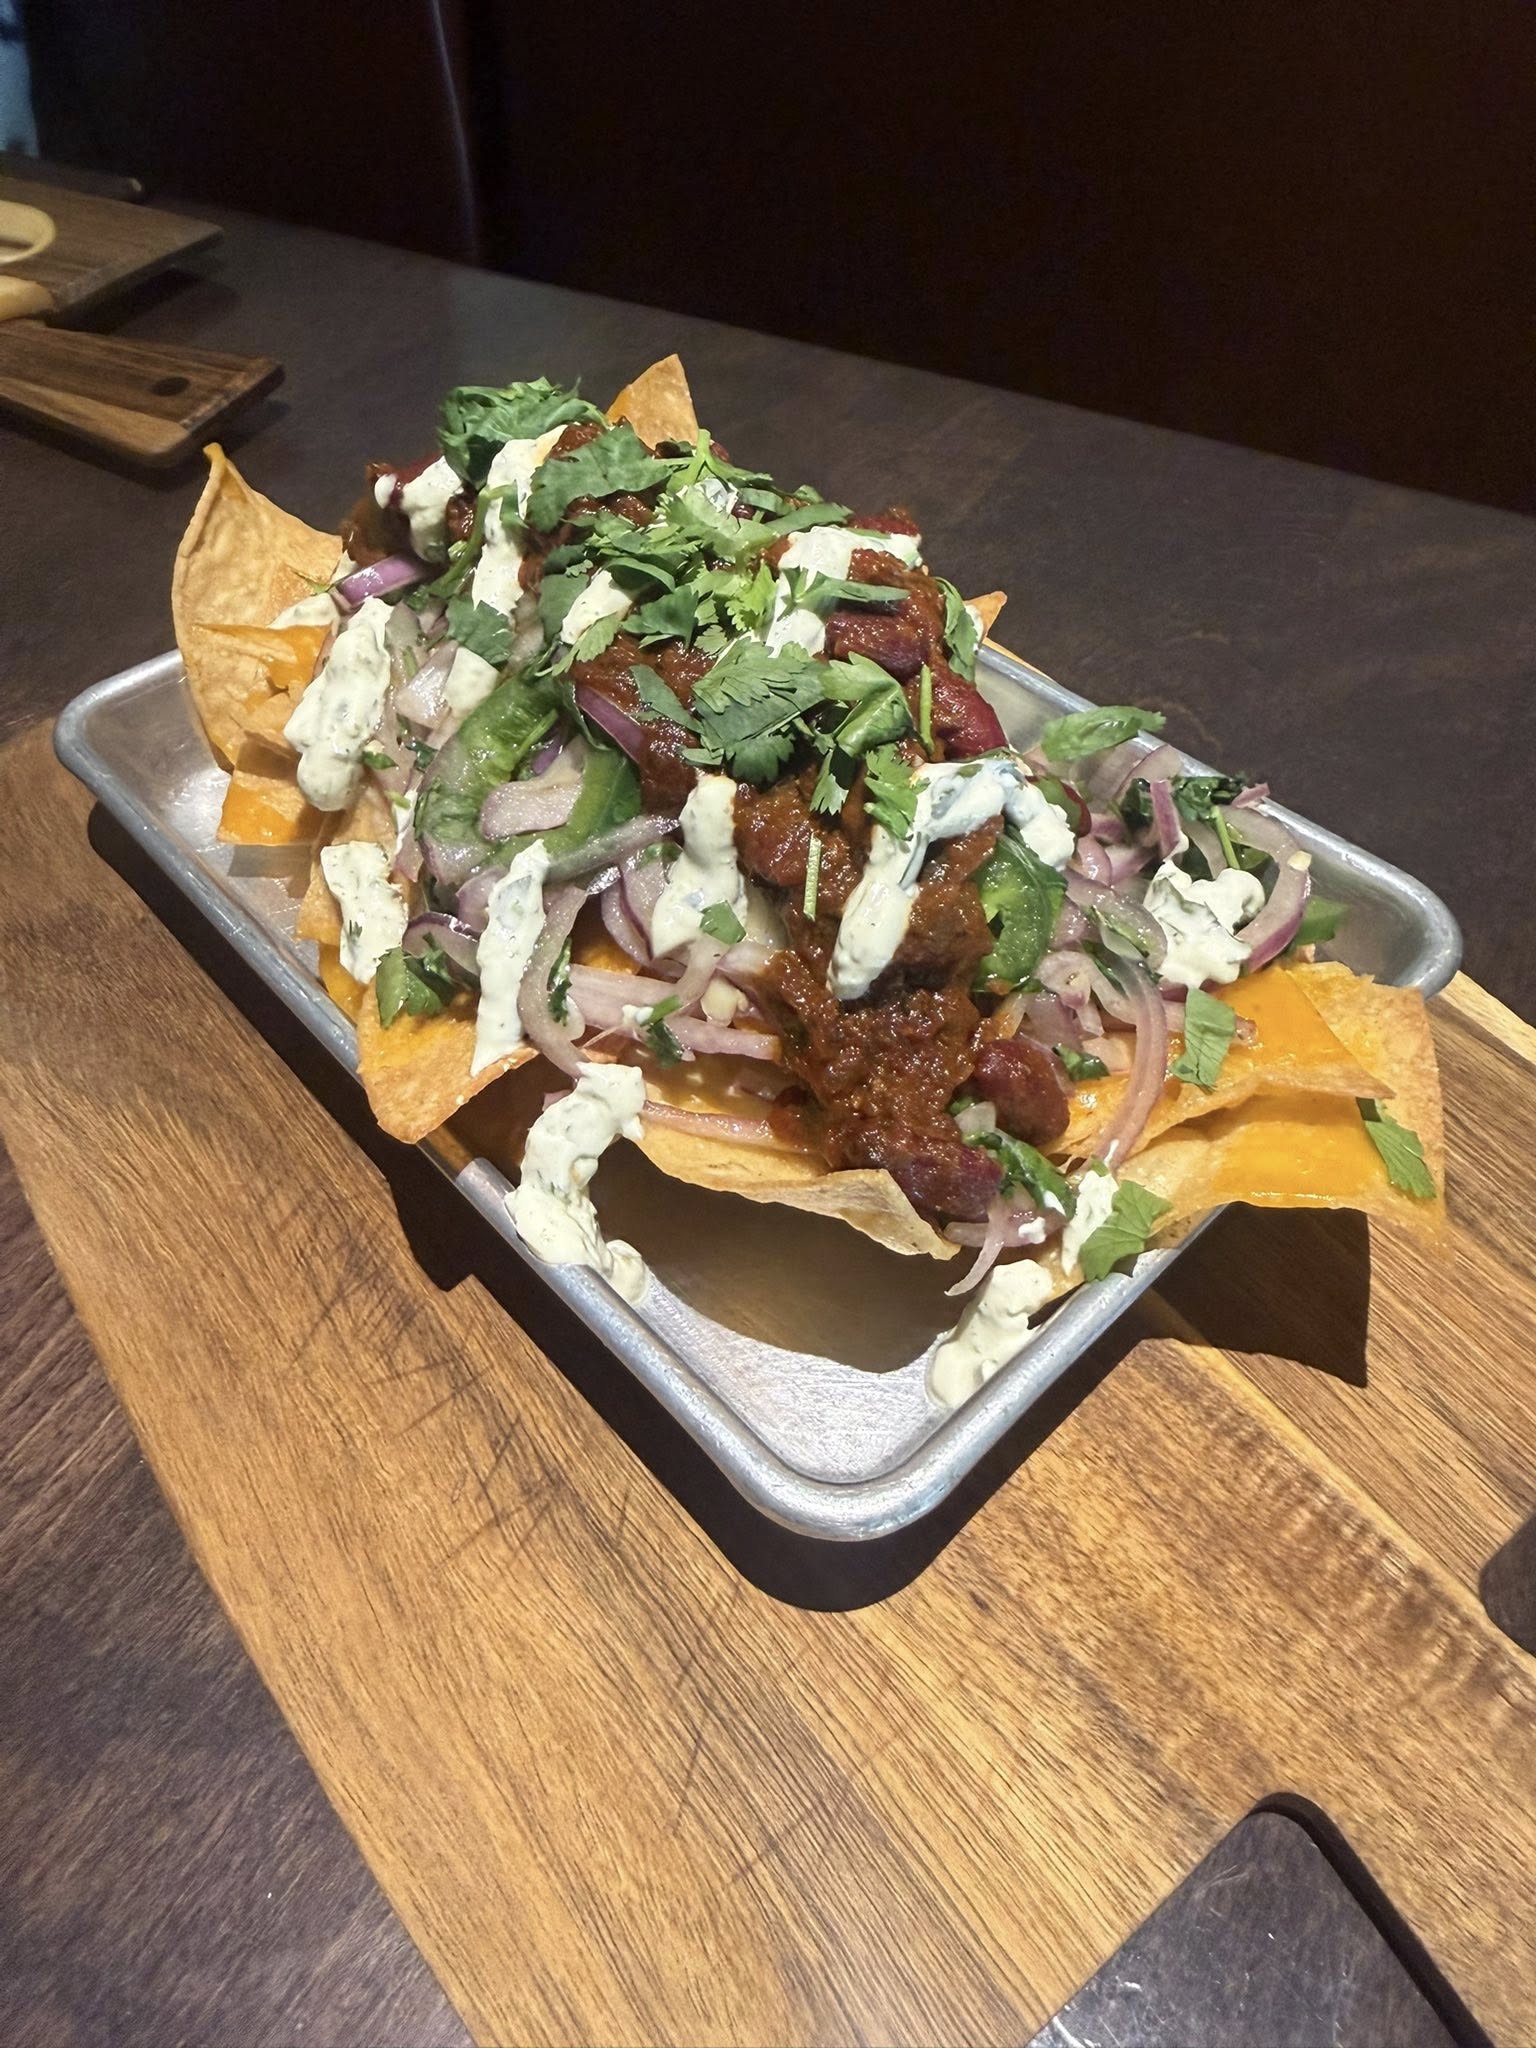 Mexican
1 Location Burrito Shop
St. Cloud, MN · 5 months live
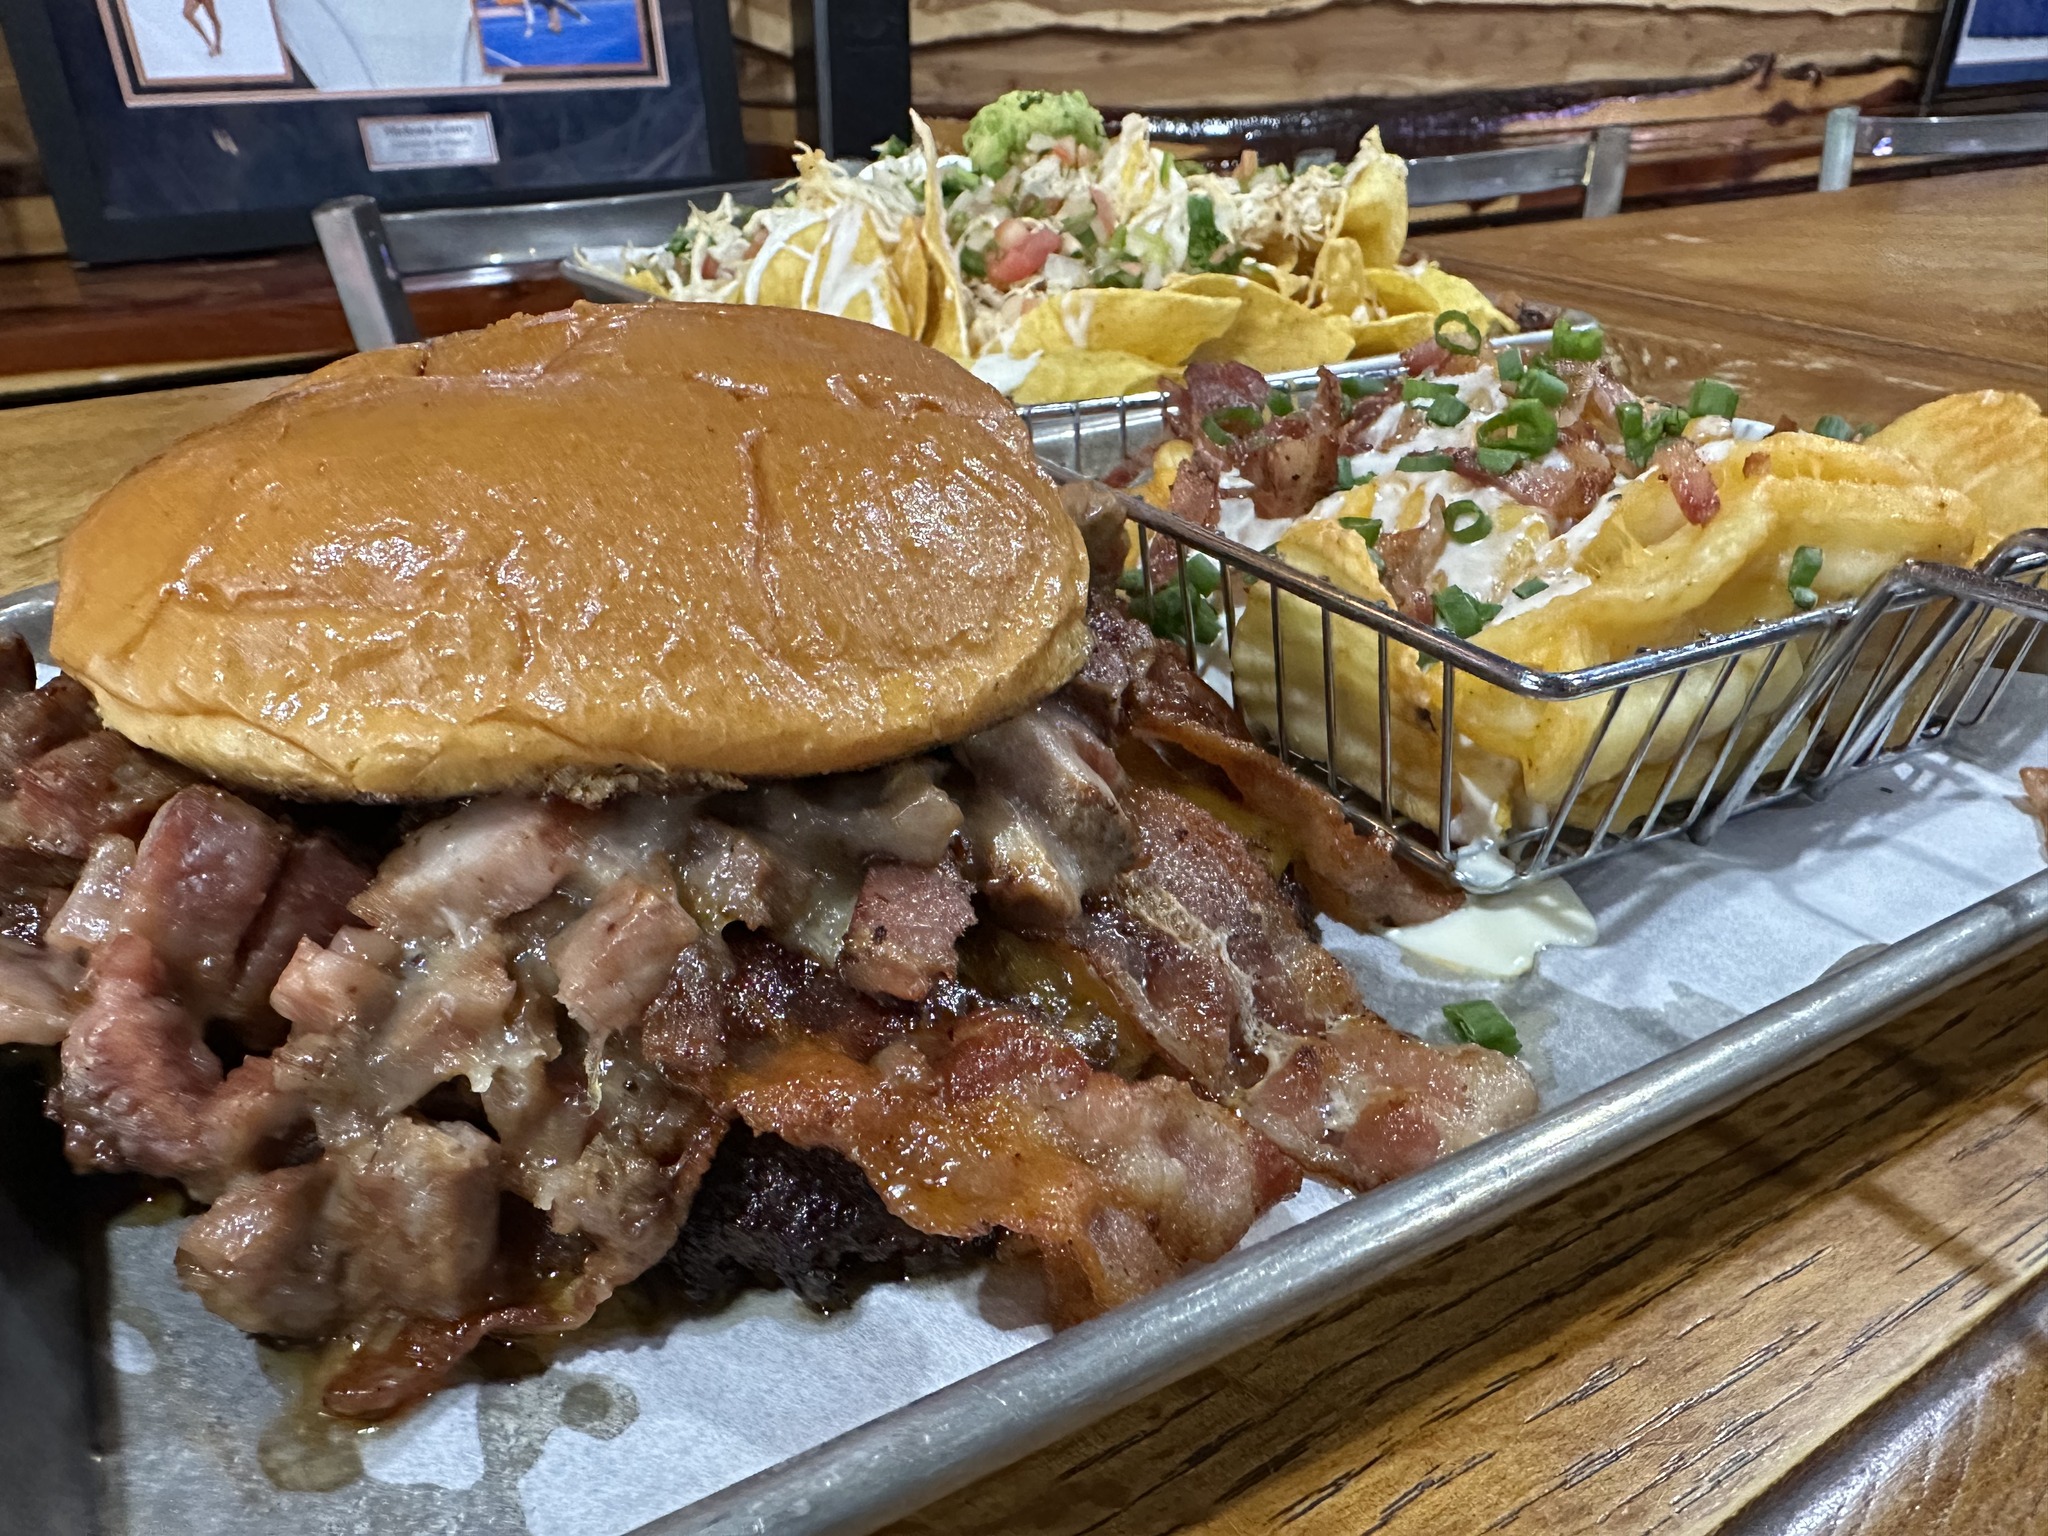 Sports Tavern
1 Location Sports Tavern
Suburban Philadelphia, PA · 5 months live
Hitting Stride
6-12 months — half a year to a year in, database as asset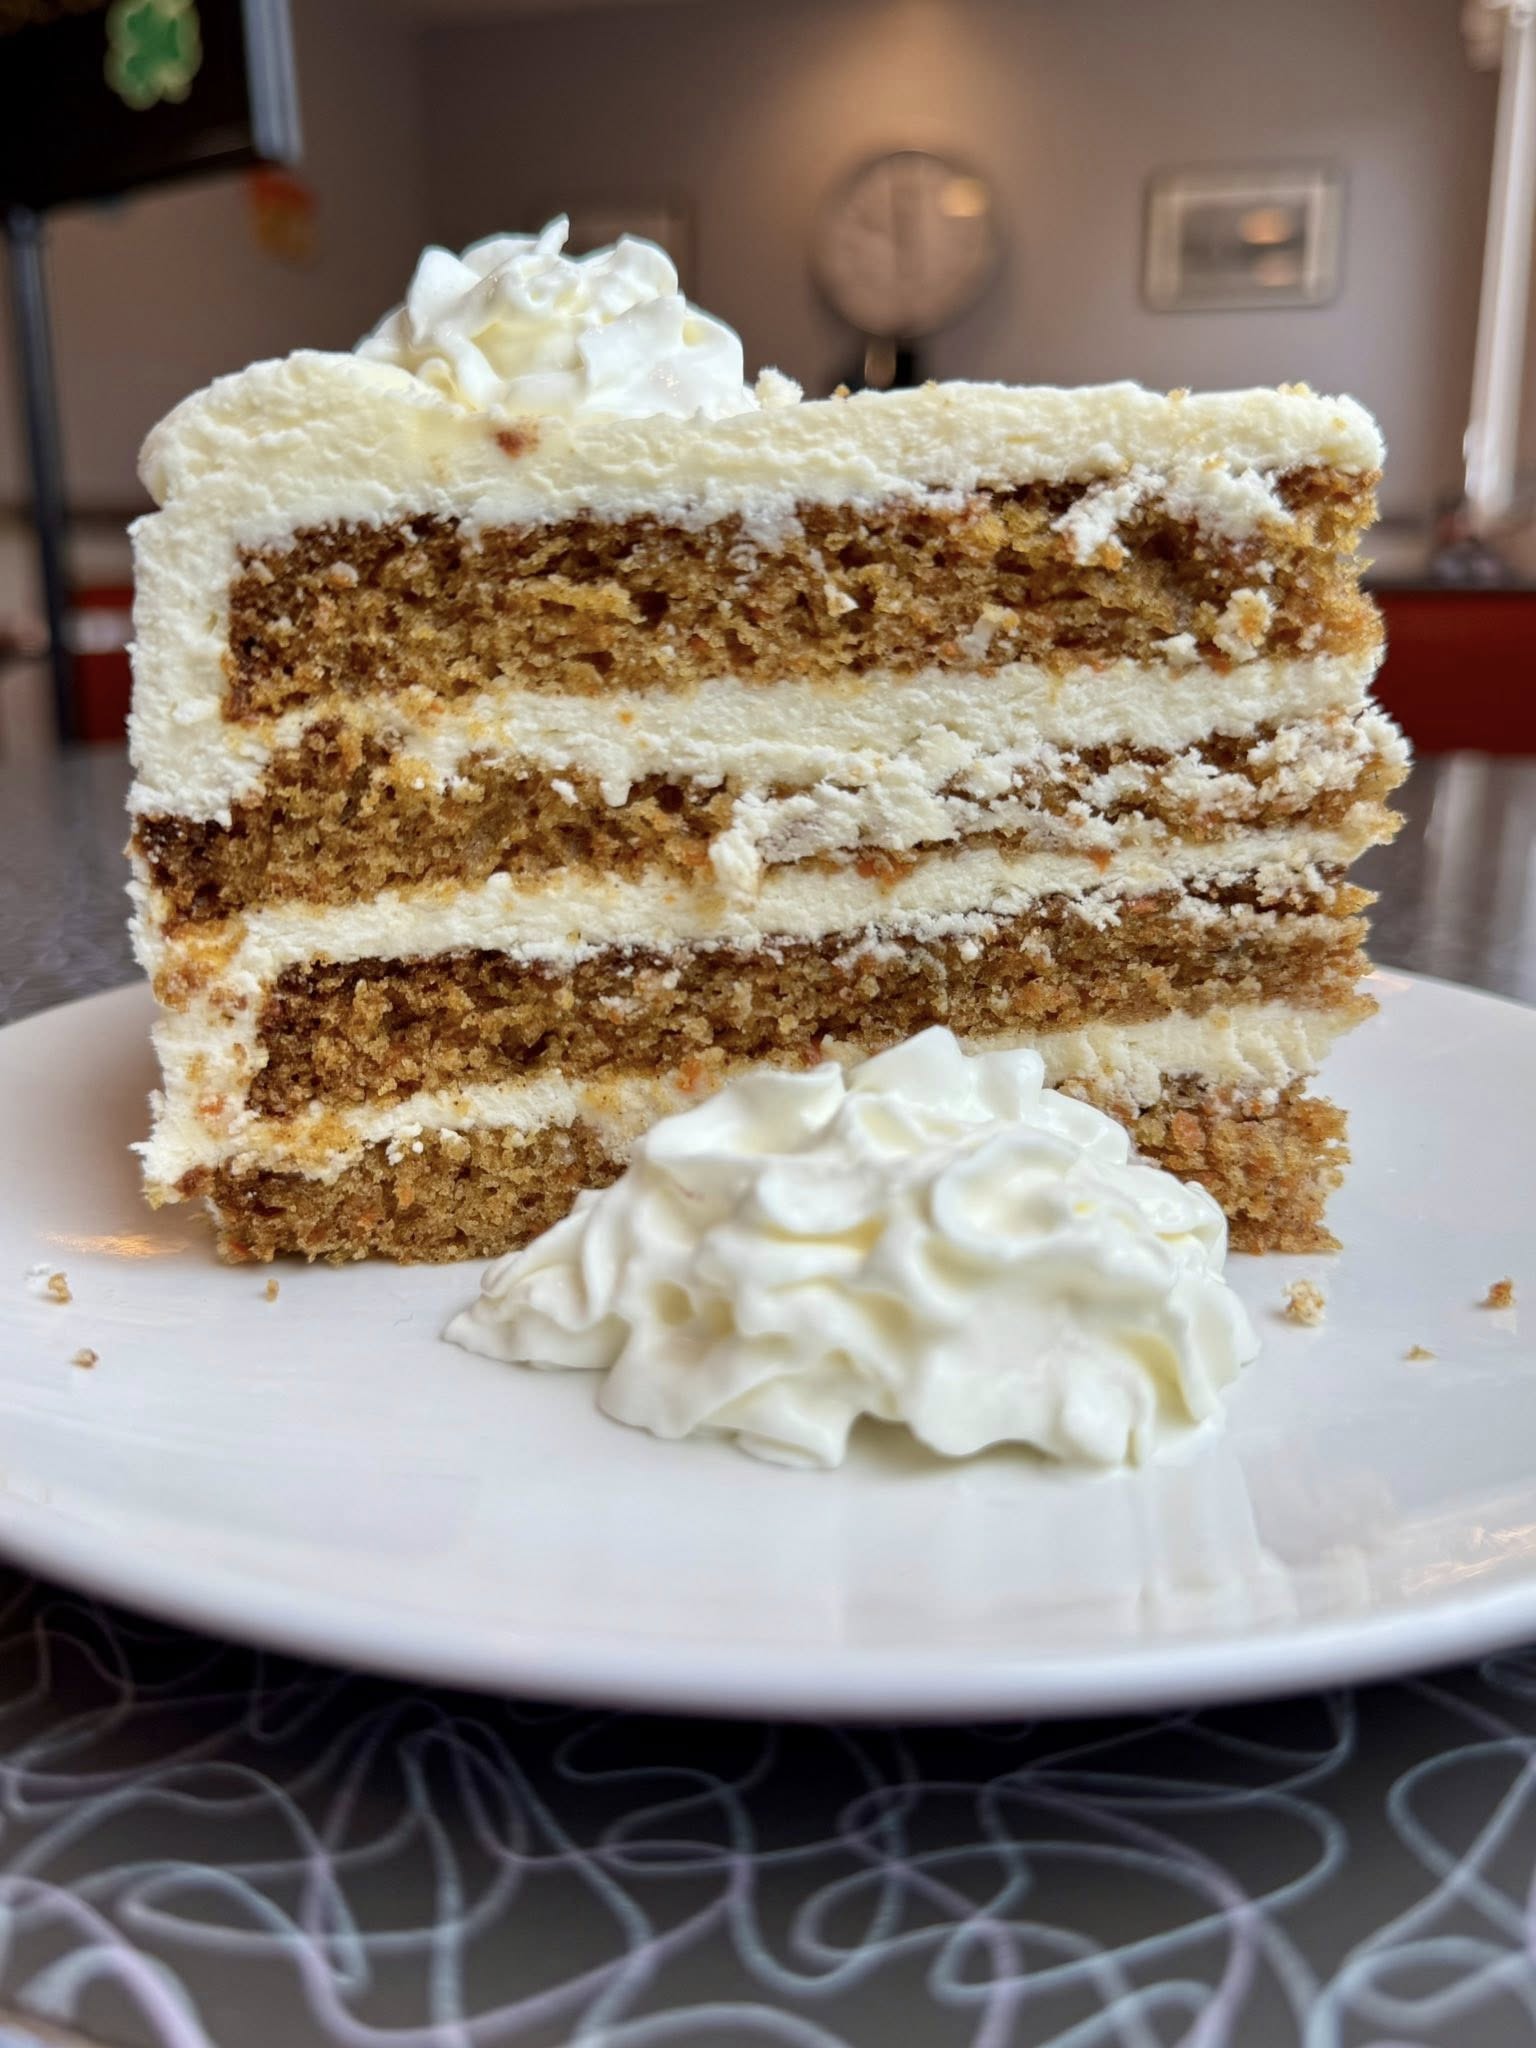 Bakery
3 Location Bakery
Bucks County, PA · 6 months live
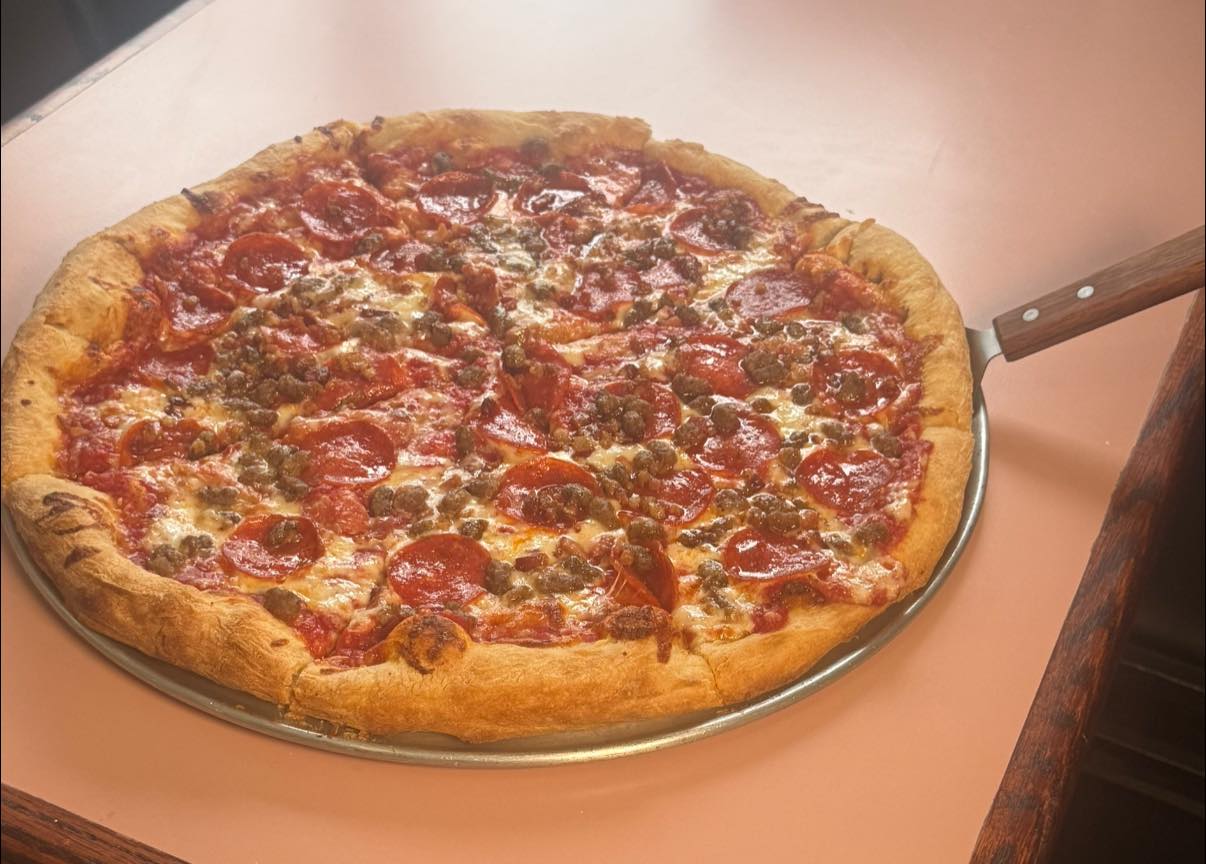 Pizza
Pizza
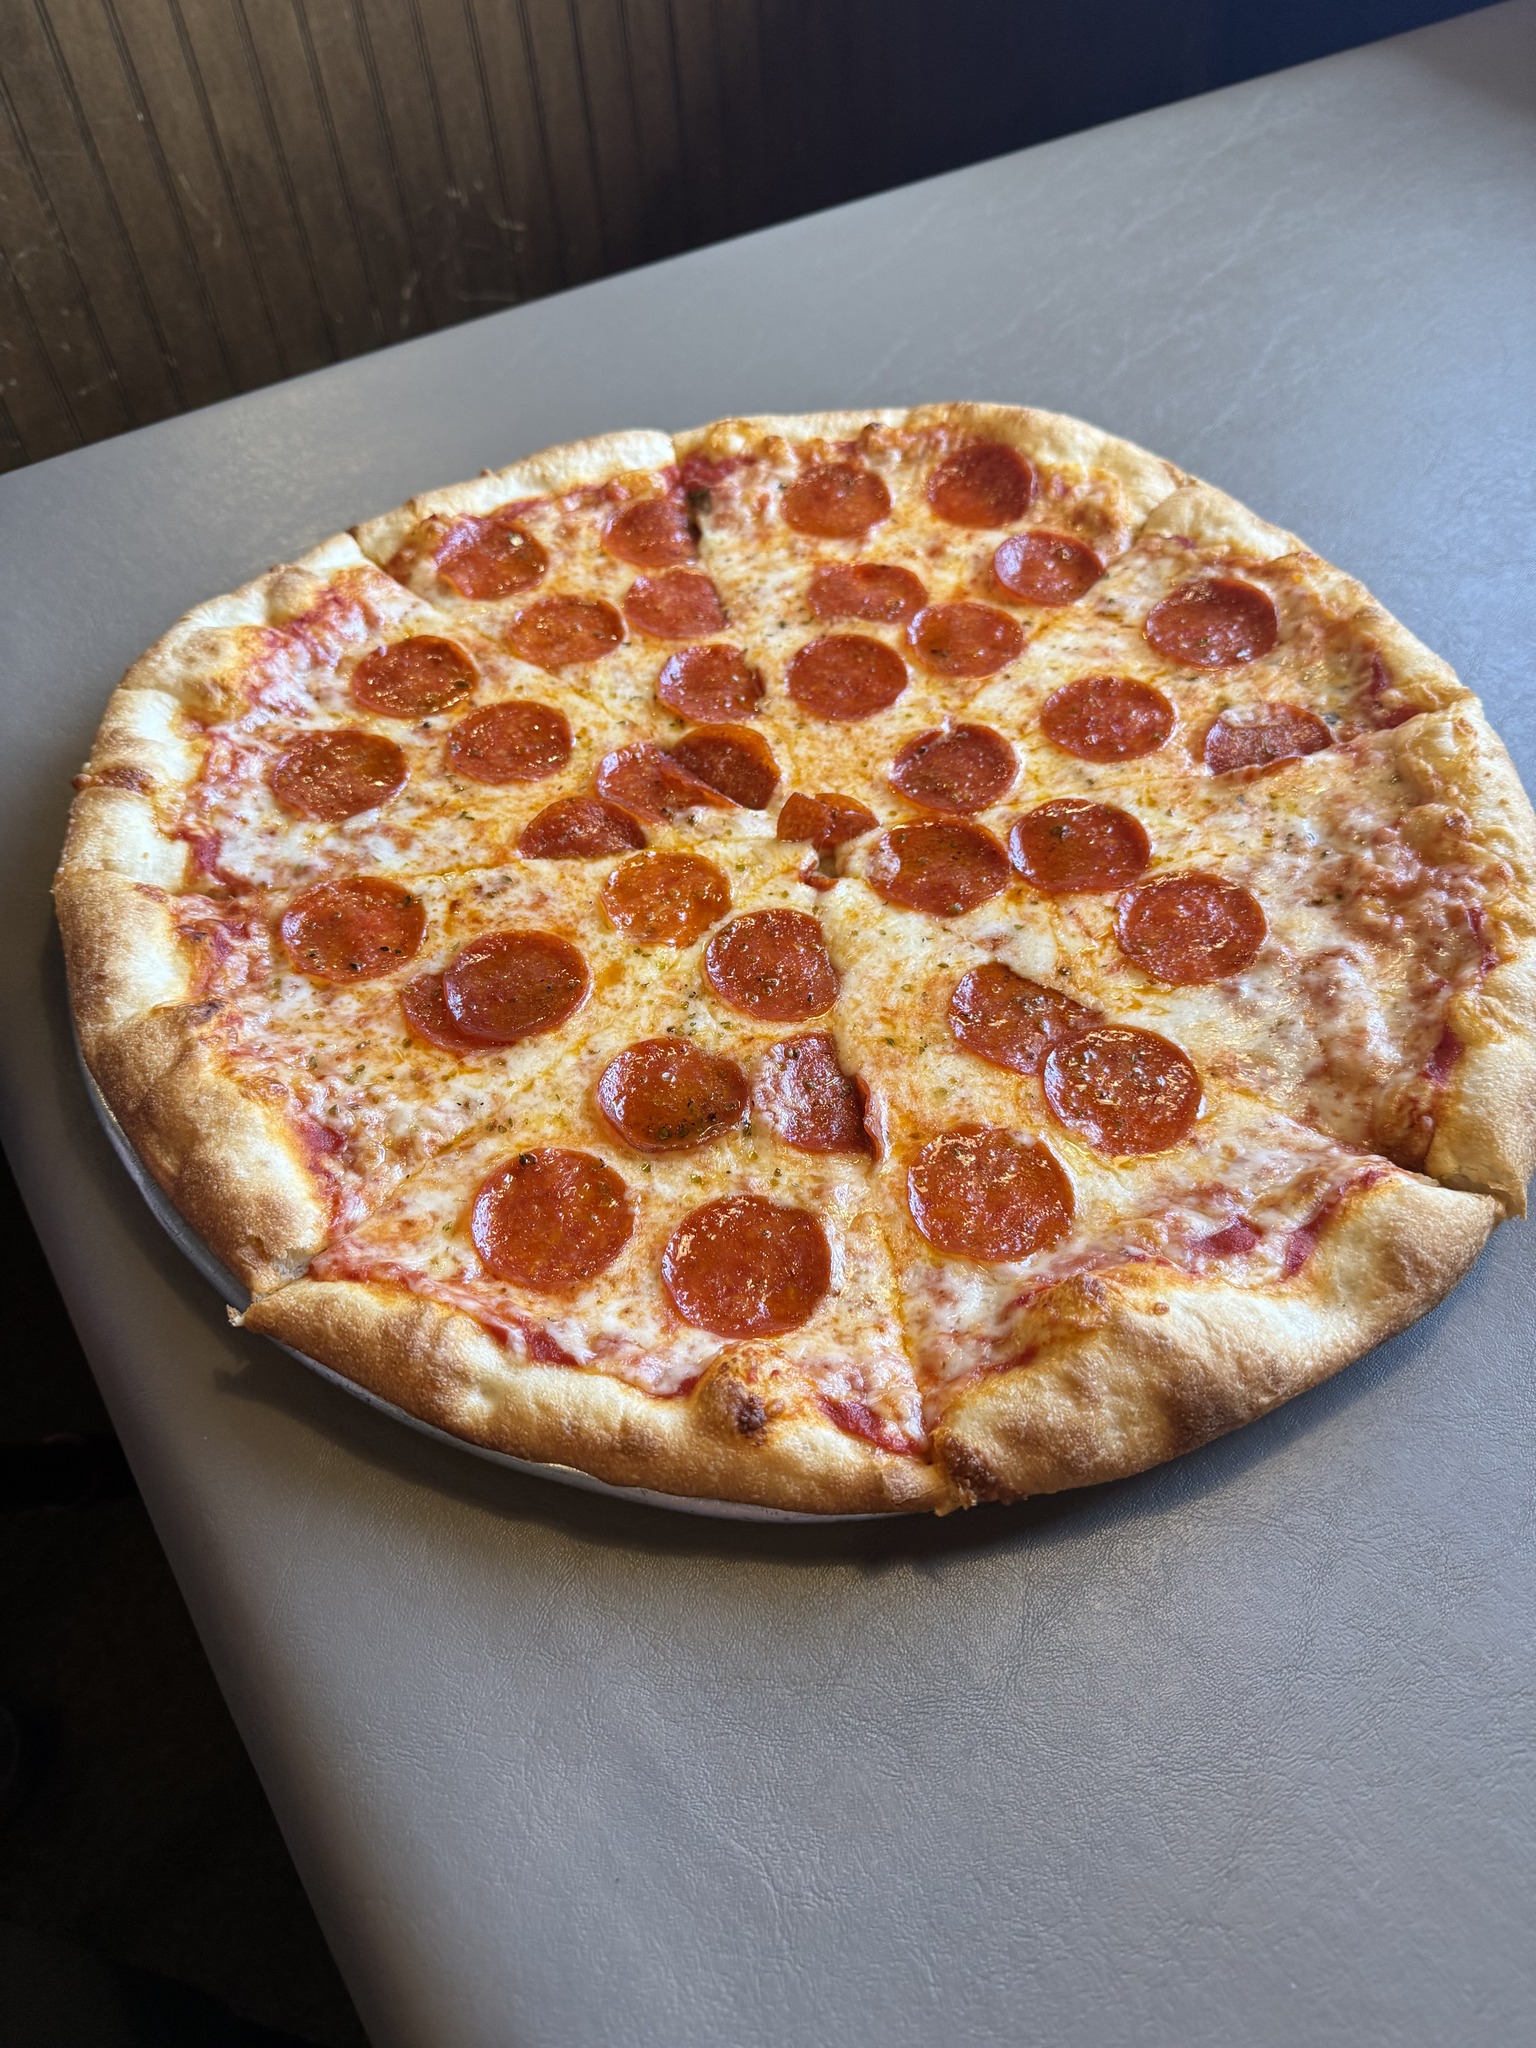
5 Location Pizzeria
Greater Orlando, FL · 6 months live
 Pizza
Pizza
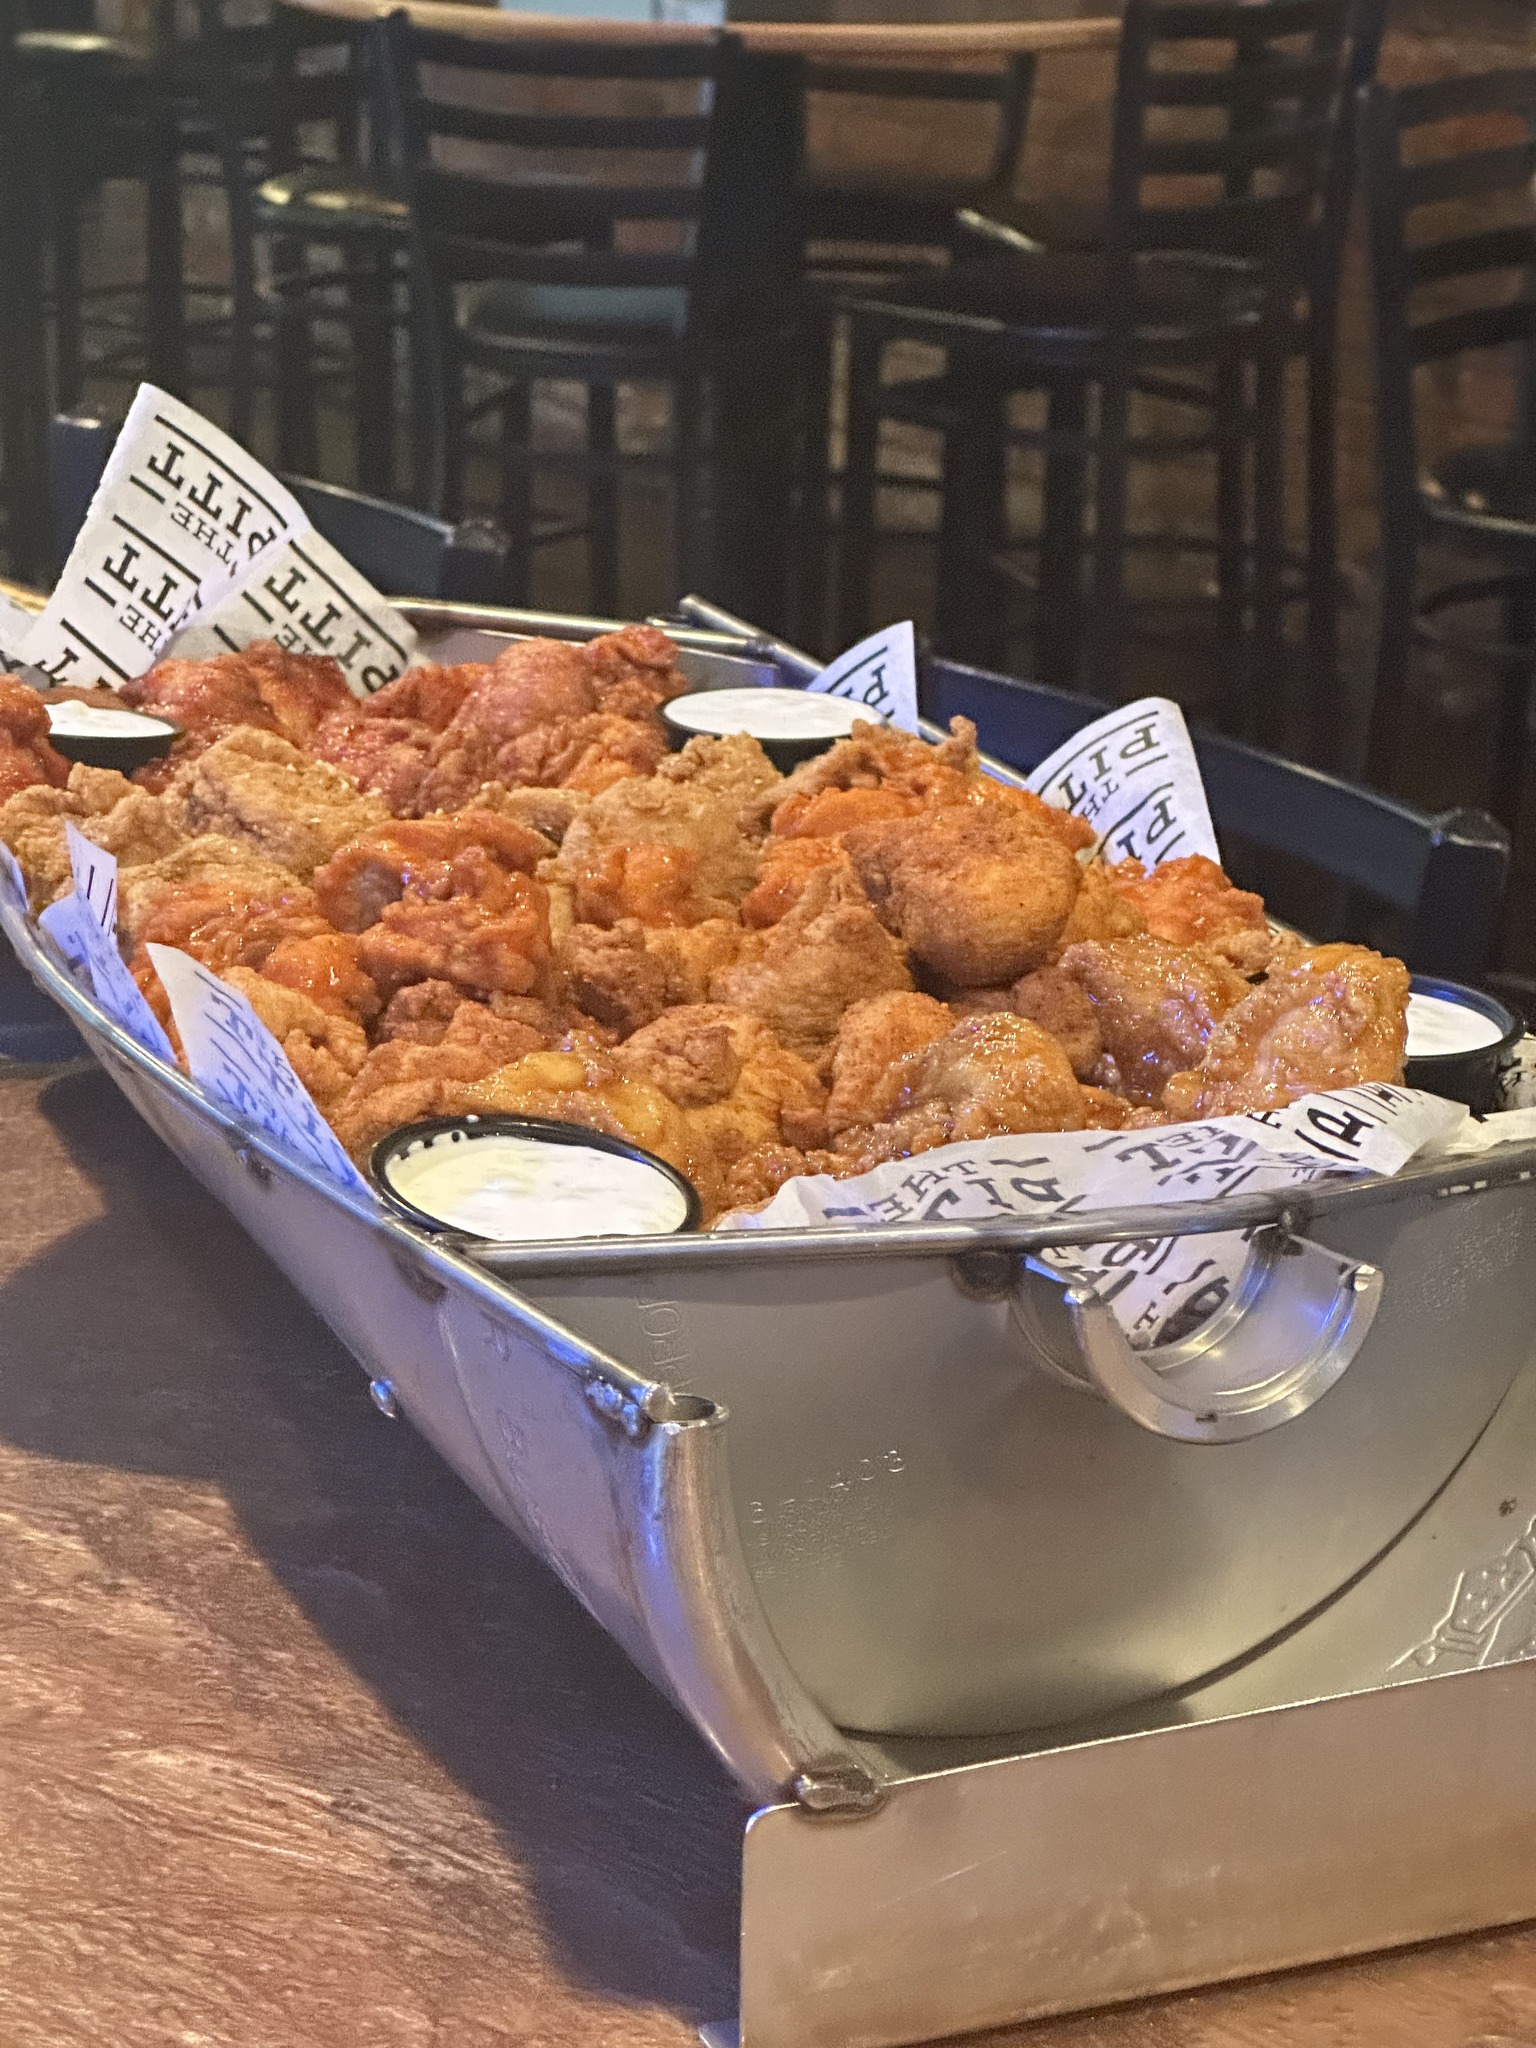
1 Location Pizzeria
North Dallas, TX · 7 months live
 Buffet
2 Location Lunch Buffet
Inland Empire, CA · 9.5 months live
Flagship Programs
3+ years — the long-term compounding play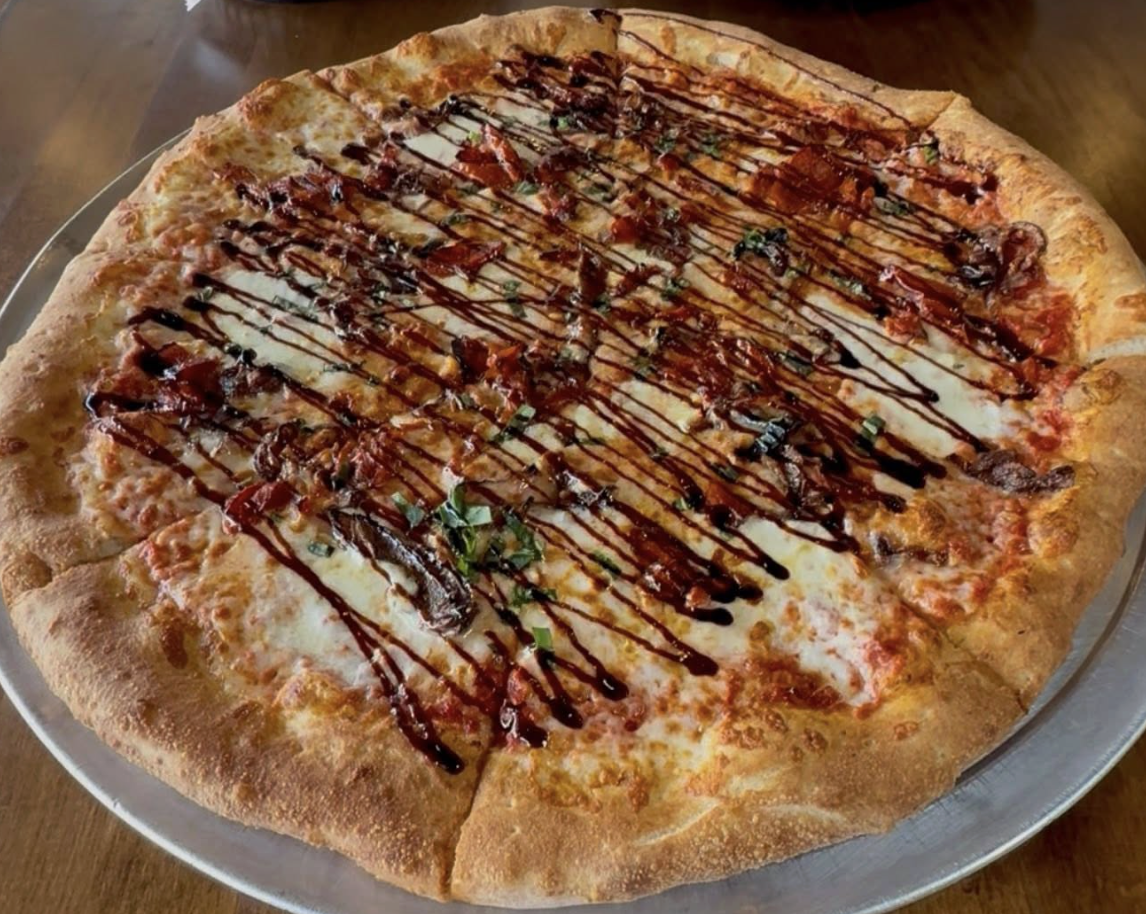 Wood-Fired Pizza
2 Location Wood-Fired Pizzeria
SW Chicago Suburbs, IL · 3 years live
 Pub & Steakhouse
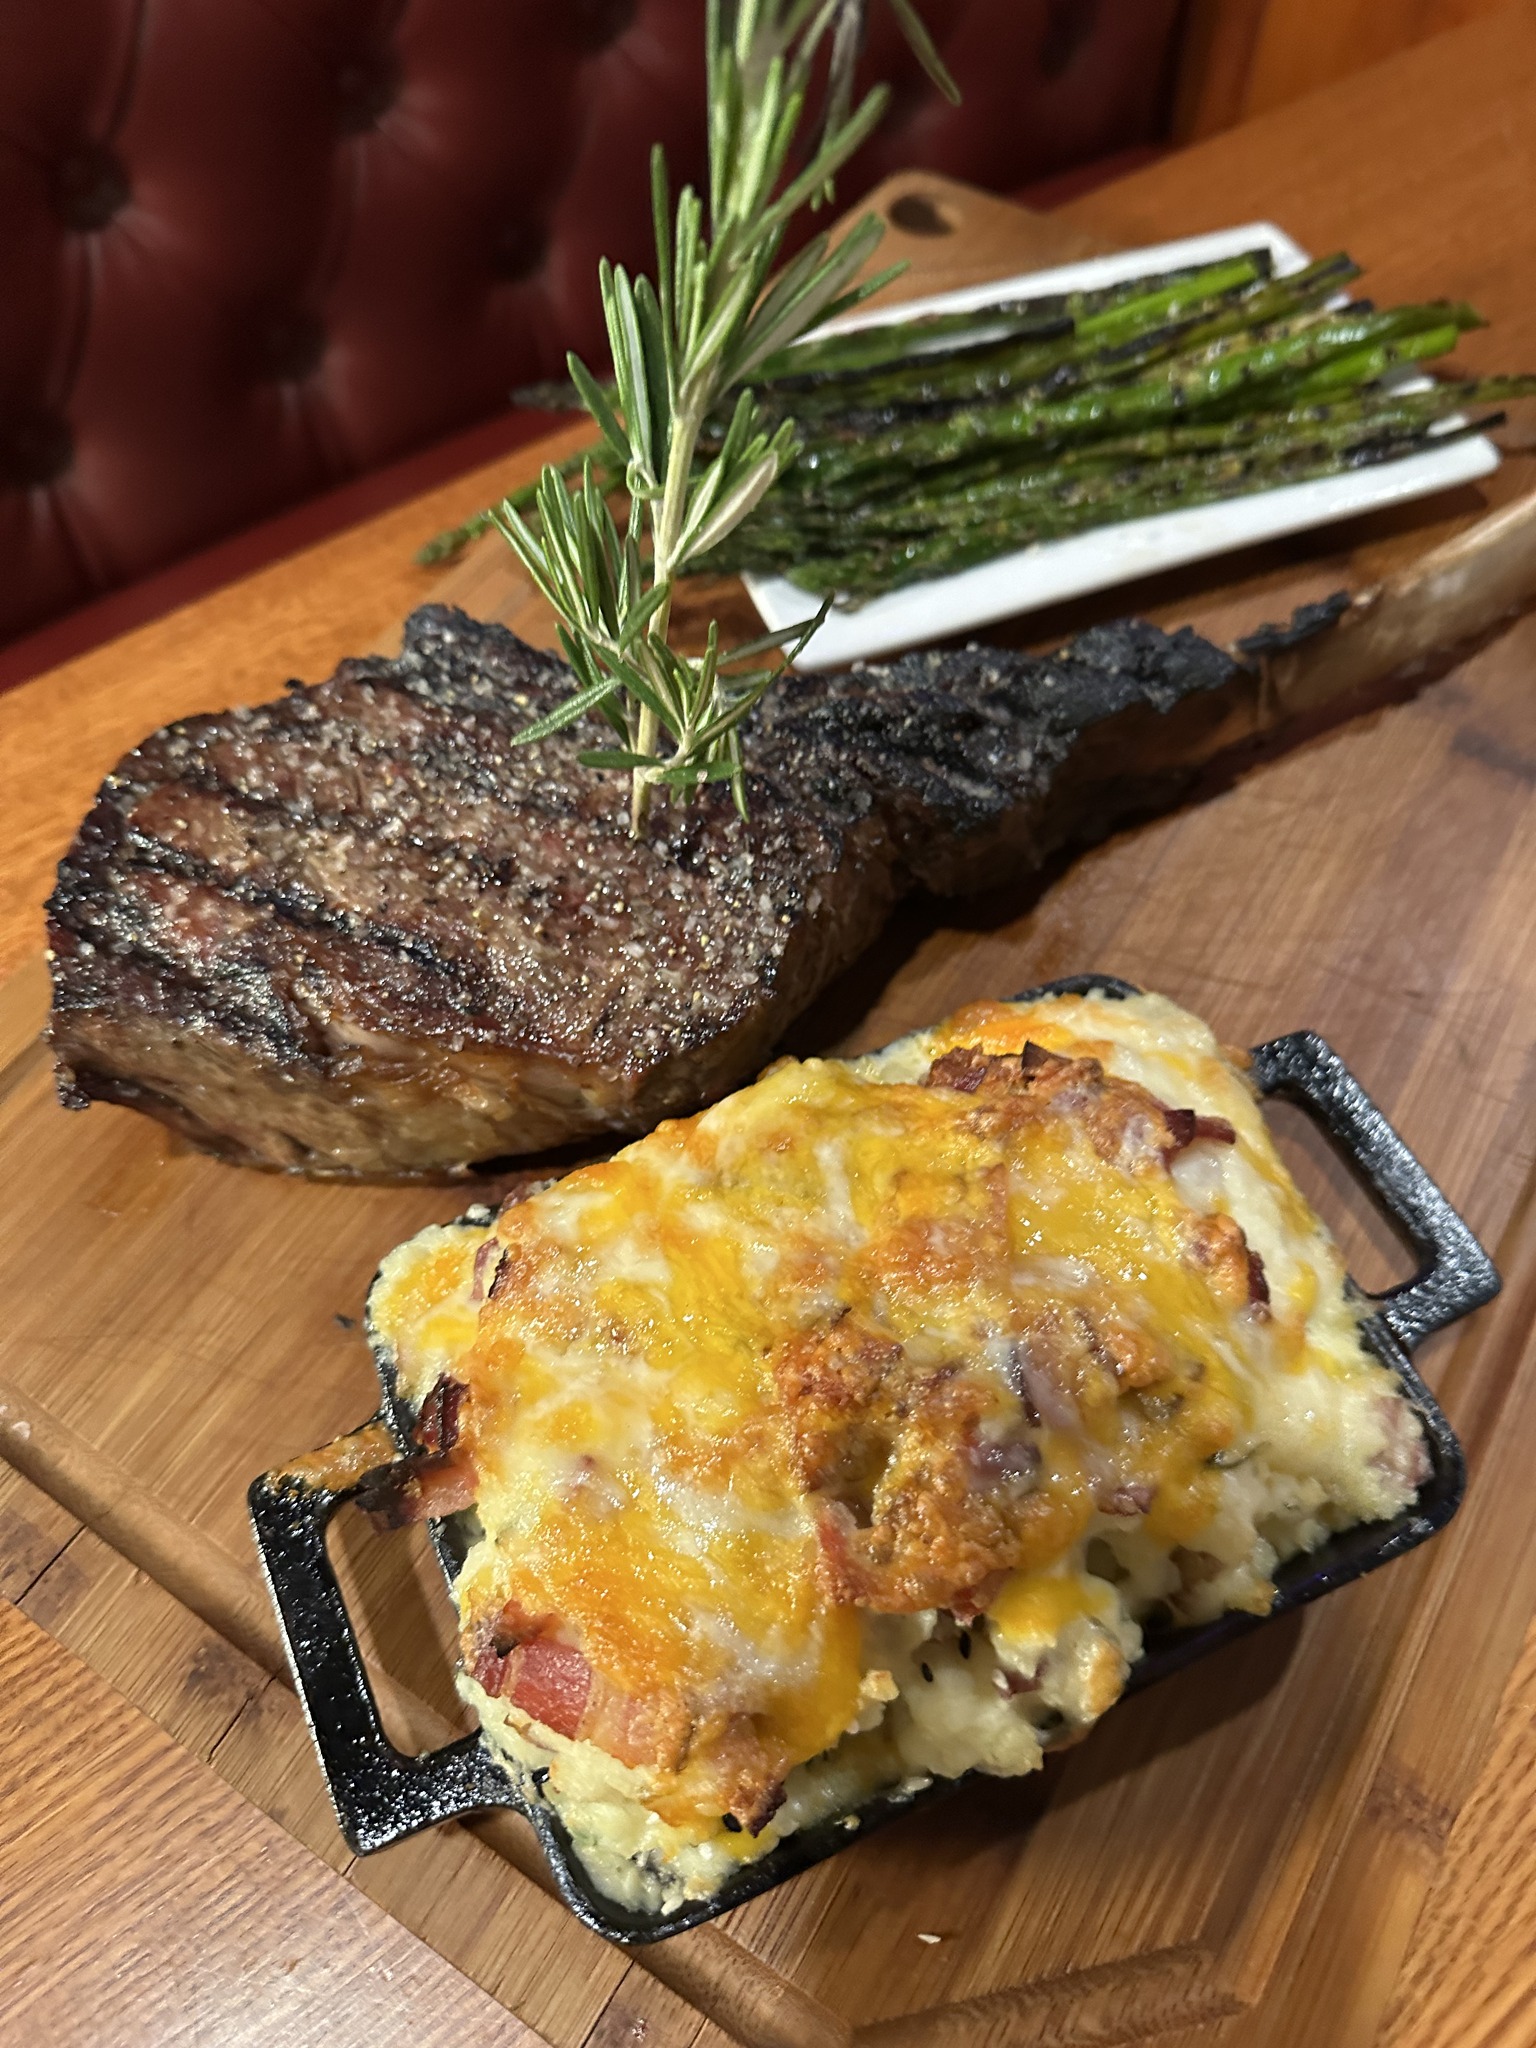
1 Location Pub & Steakhouse
Twin Cities Exurbs, MN · 3 years live
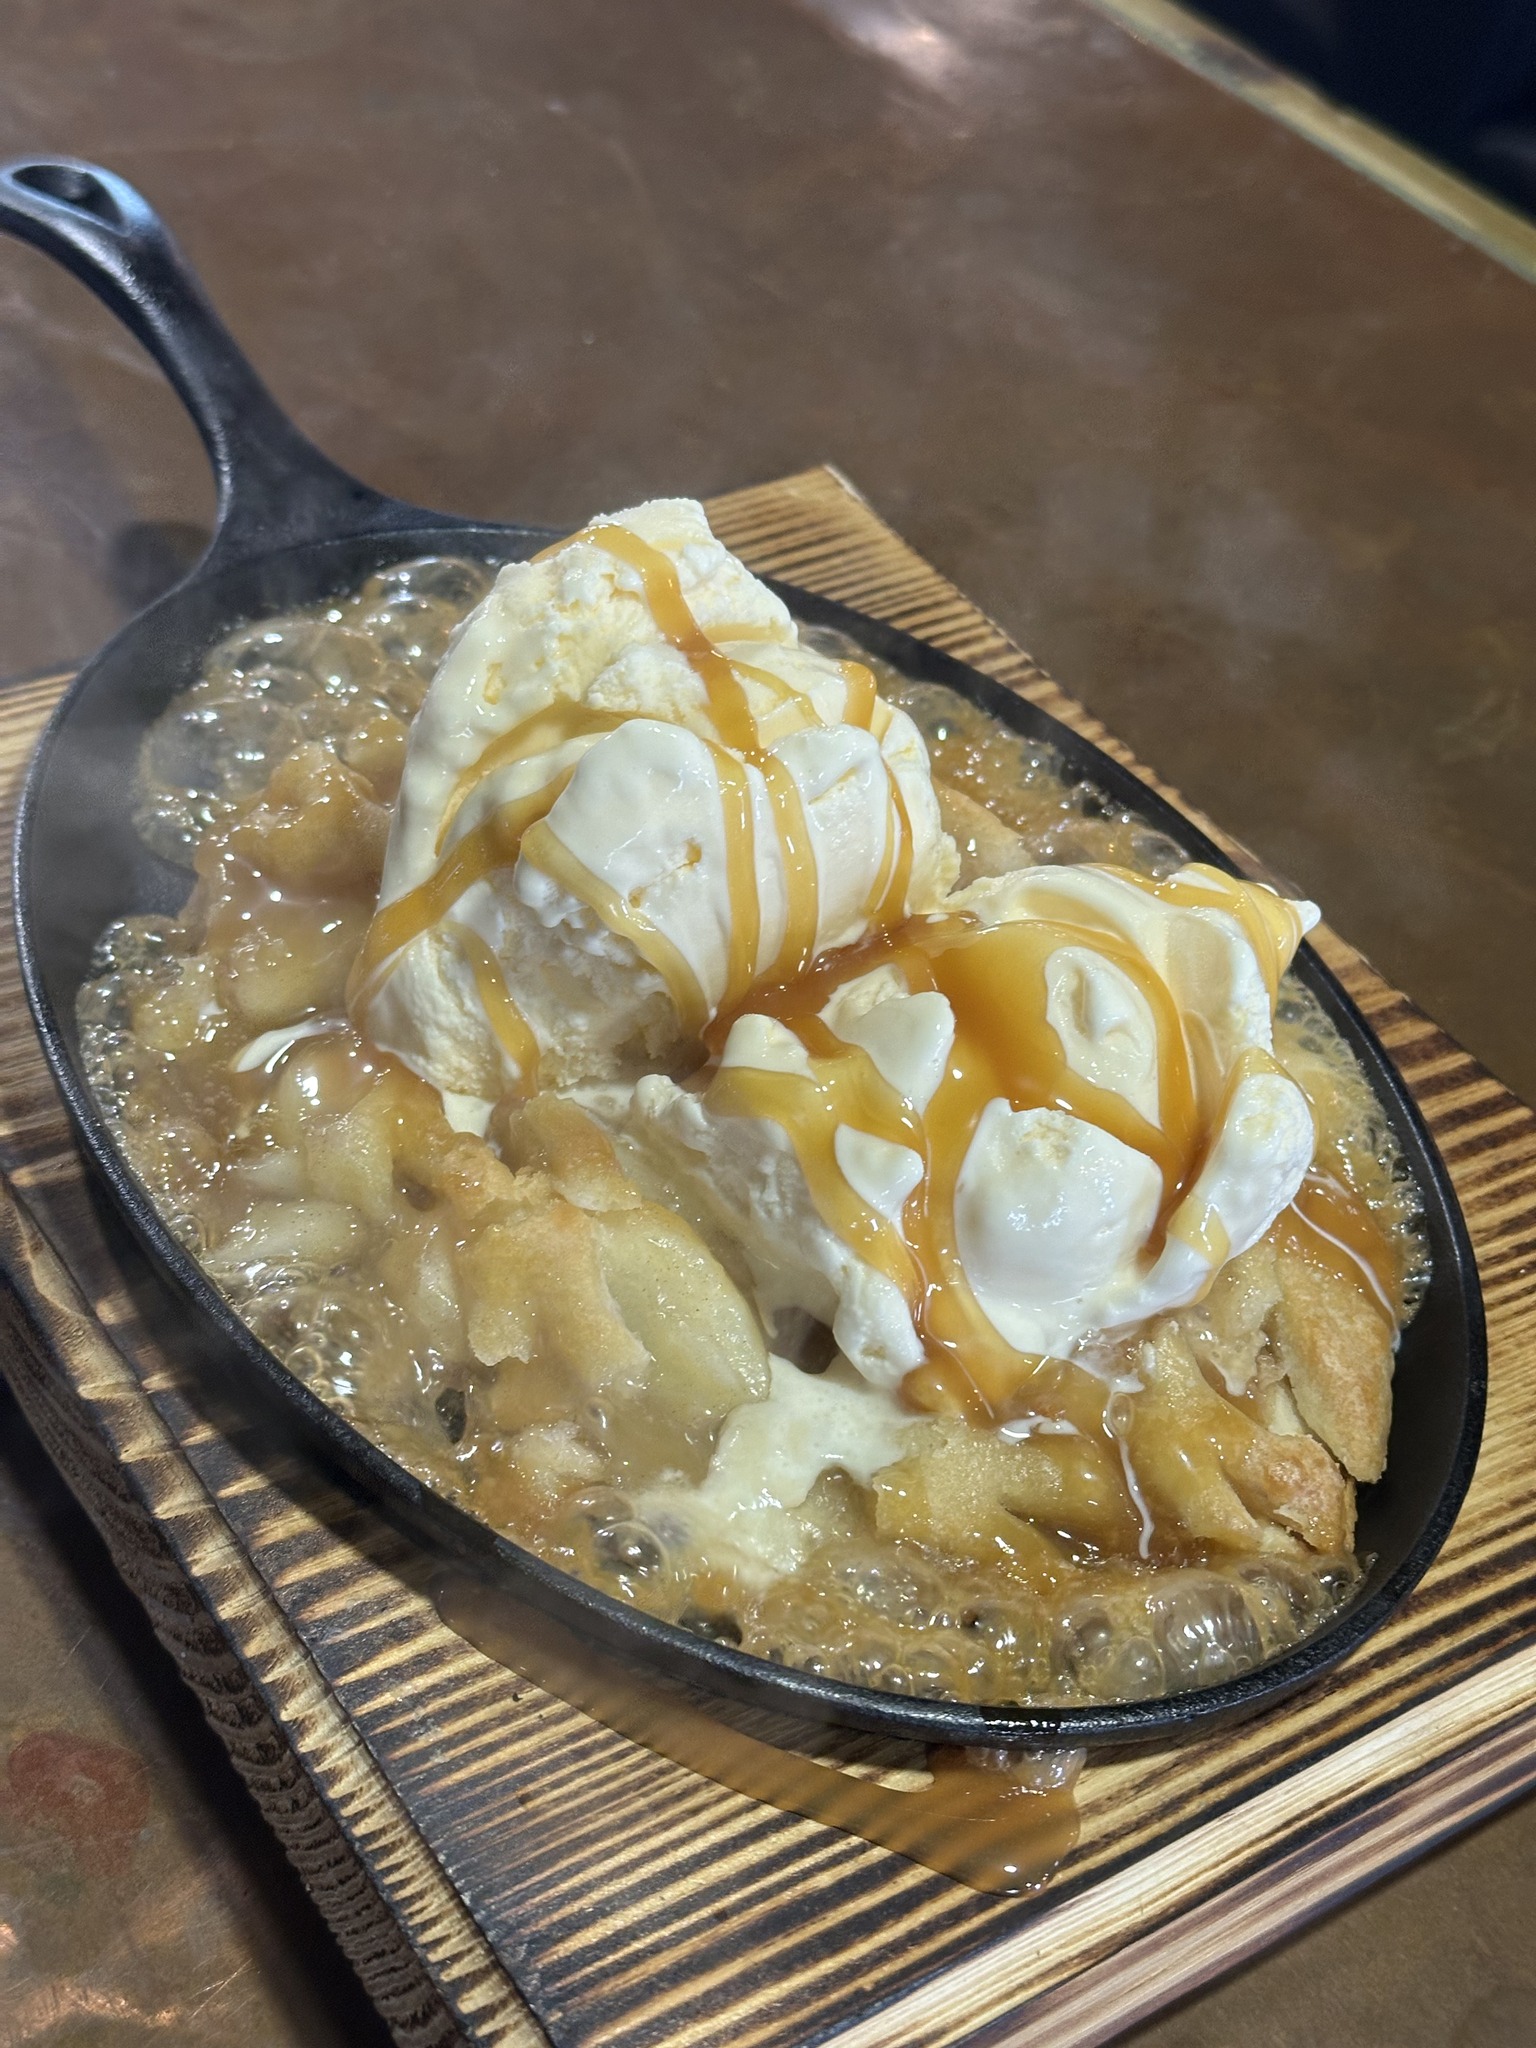 Neighborhood Pub
1 Location Neighborhood Pub
Bucks County, PA · 4.3 years live
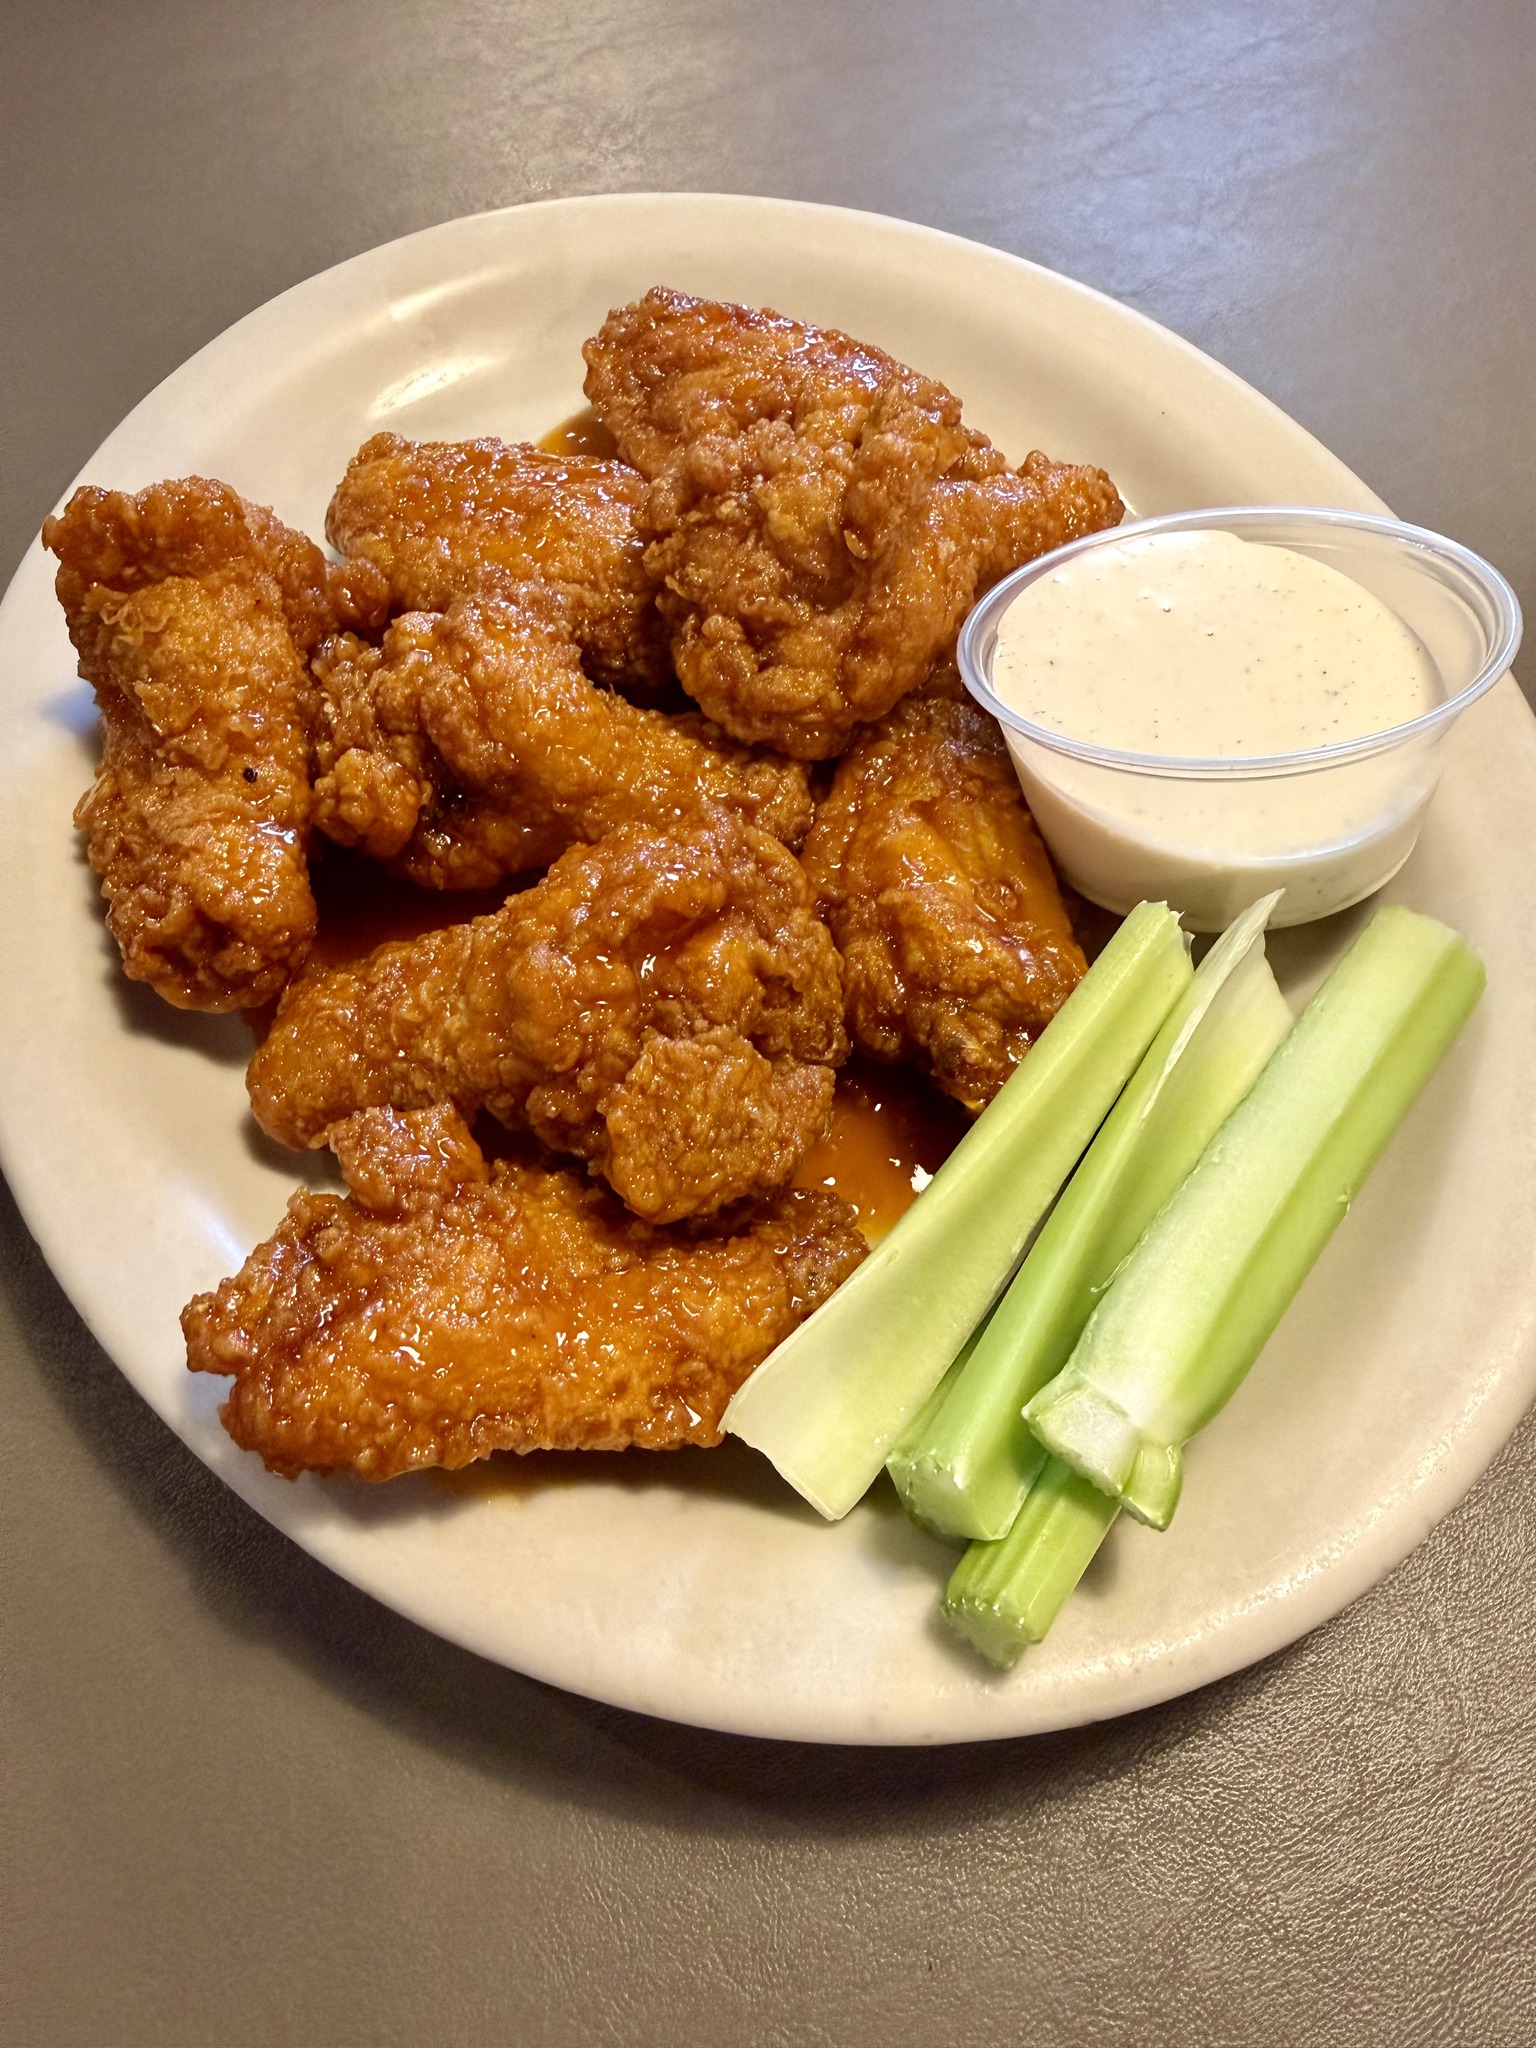 Sports Bar
3 Location Sports Bar
West Valley Phoenix, AZ · 4.3 years live
No case studies match this filter. Try a different combination.
What To Expect
Year 1 sets the foundation. The system compounds from there.
Conservatively, in your first year, expect a 3,000–4,000 person opted-in database, $30–35K in tracked sales, and ~10–12x ROAS. From there, the system compounds — our 3–4 year clients are at $235–295K in tracked sales and 9,400–13,200 owned contacts.
Does This Look Like Your Restaurant?
- Independently owned
- $750,000+ in annual sales
- 50+ seats, primarily dine-in
- Open More Than A Year
- Ready to grow your sales
If this is you and you're looking to grow your sales with a marketing program that has a proven ROI every month, click below.
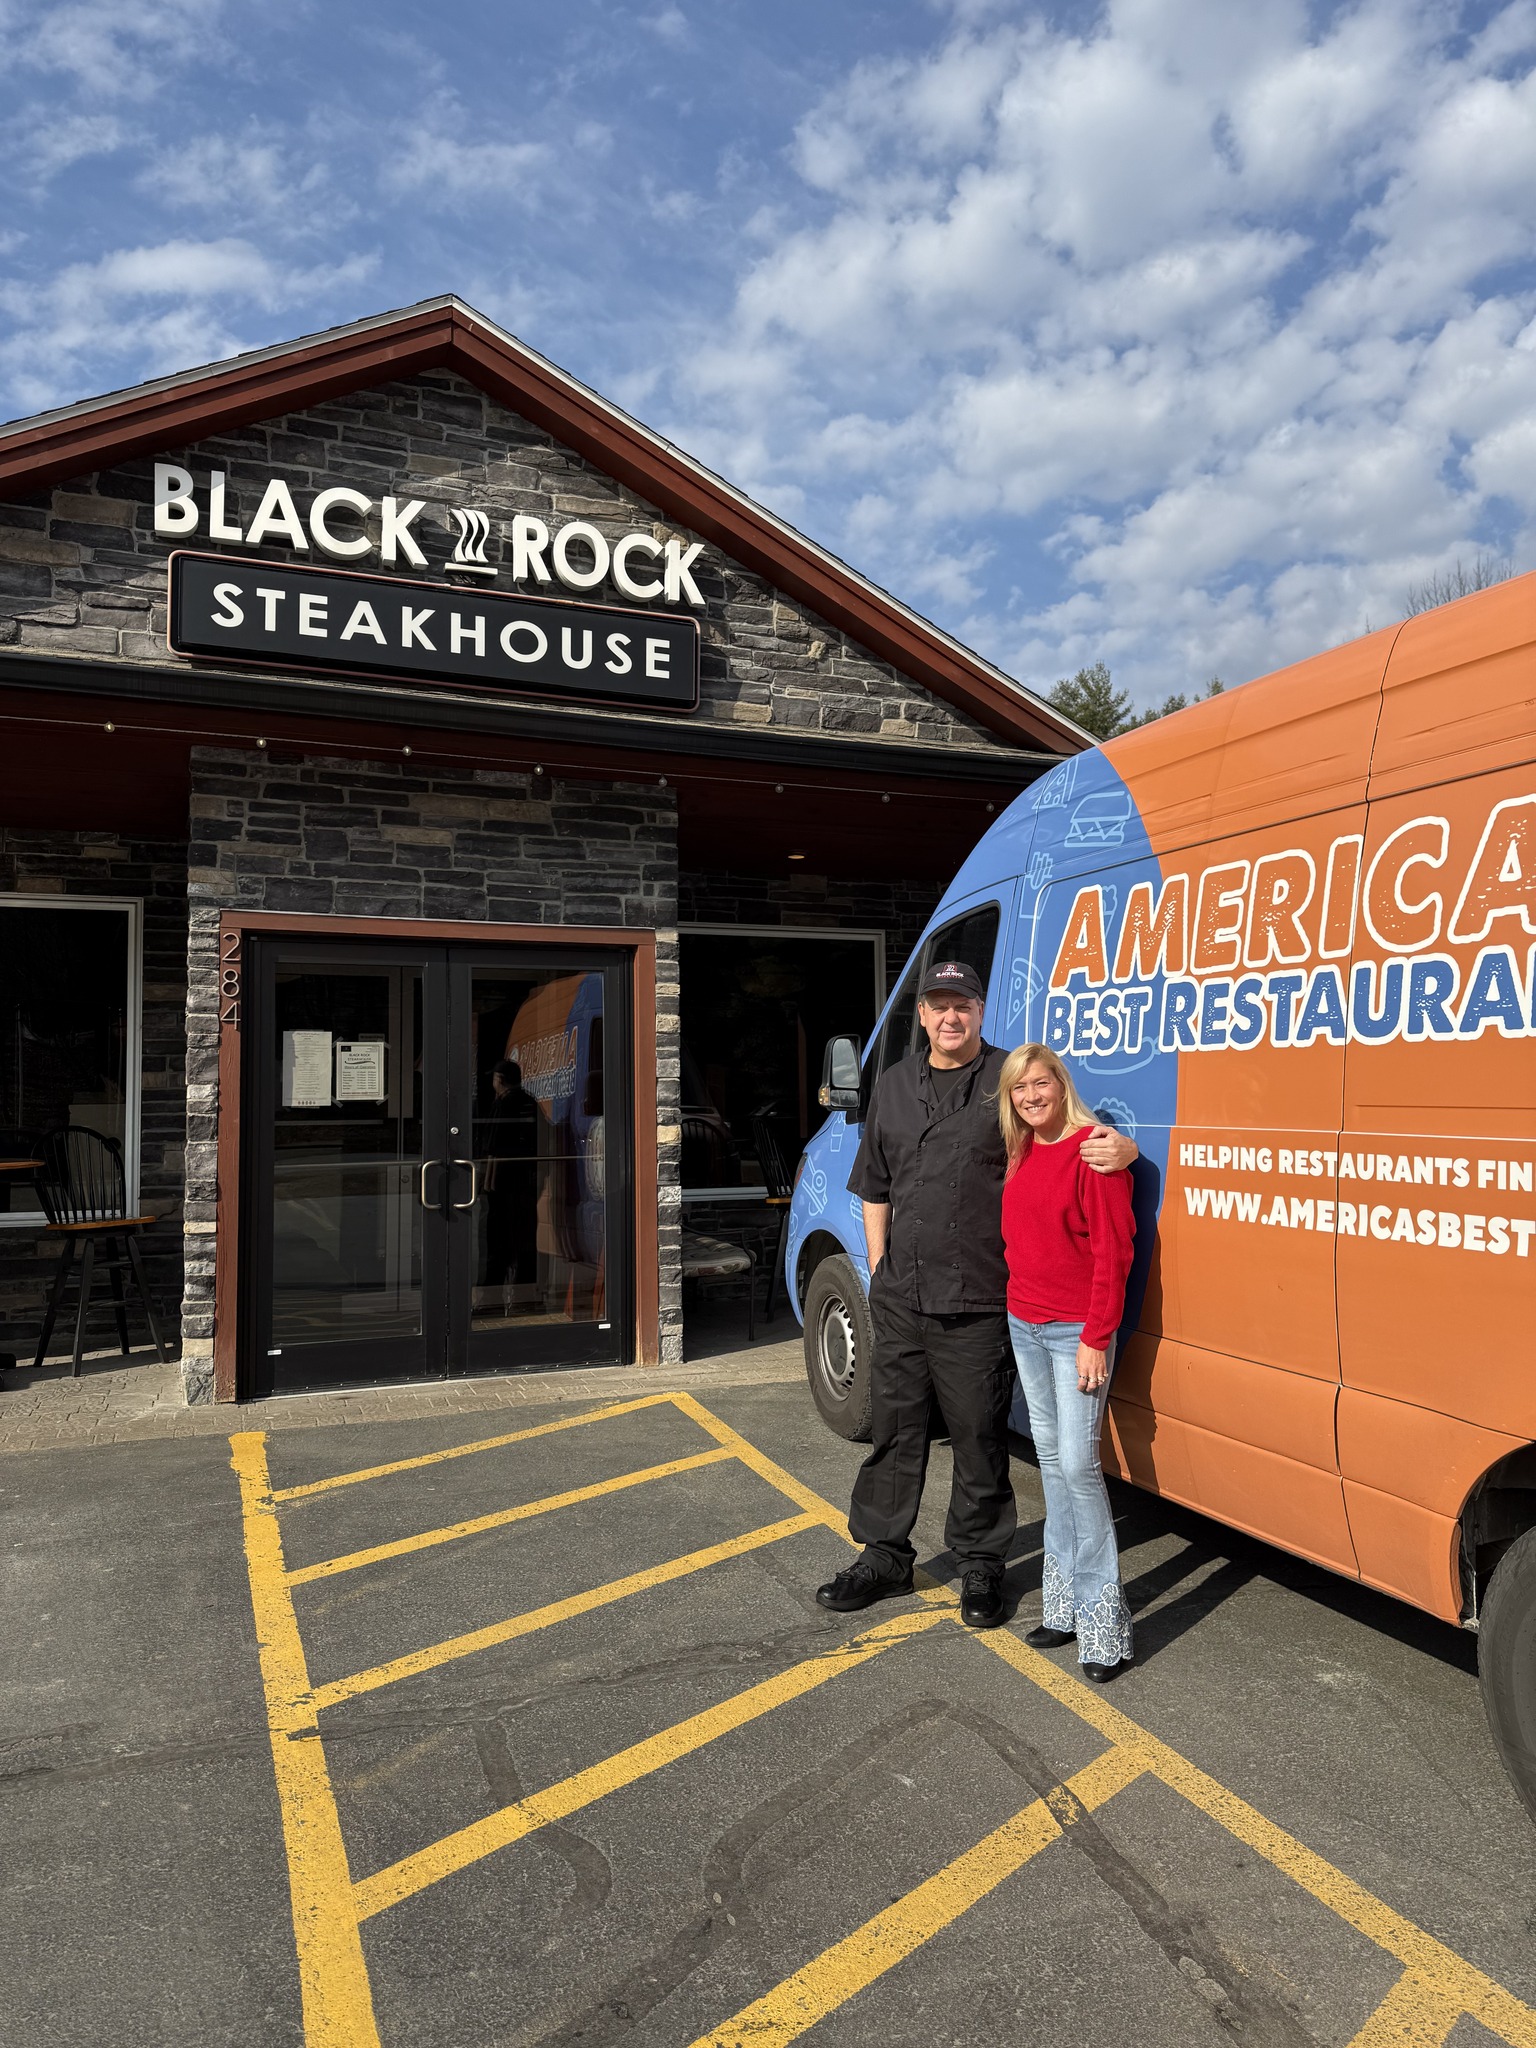
Photos on this page are for visual reference only. Images may not depict the specific restaurant, location, staff, or menu item referenced in a case study.
Case study metrics reflect actual dashboard reporting from the restaurants referenced. Individual restaurant results vary based on market, concept, offer mechanics, operational execution, timing, and other factors. Past performance is not indicative of future results.
Schedule Your WIN Meeting
Pick a time that works for you.