
$99,000 In Sales From Customers They'd Already Lost…Over 3 Years.
Case Study
A 1-location pub and steakhouse in the Twin Cities exurbs launched with ABR three years ago. Since then, the program has built a 9,441-person opted-in database (4,773 birthdays included), driven 4,413 visits, and pulled $235,737 in tracked sales at a $53.42 average check and 15.34x return on ad spend. The signature: 44% of every tracked dollar came from lost customers brought back — the highest reactivation share of any 3-year client in the portfolio. Three years of pulling lapsed regulars back to the table.
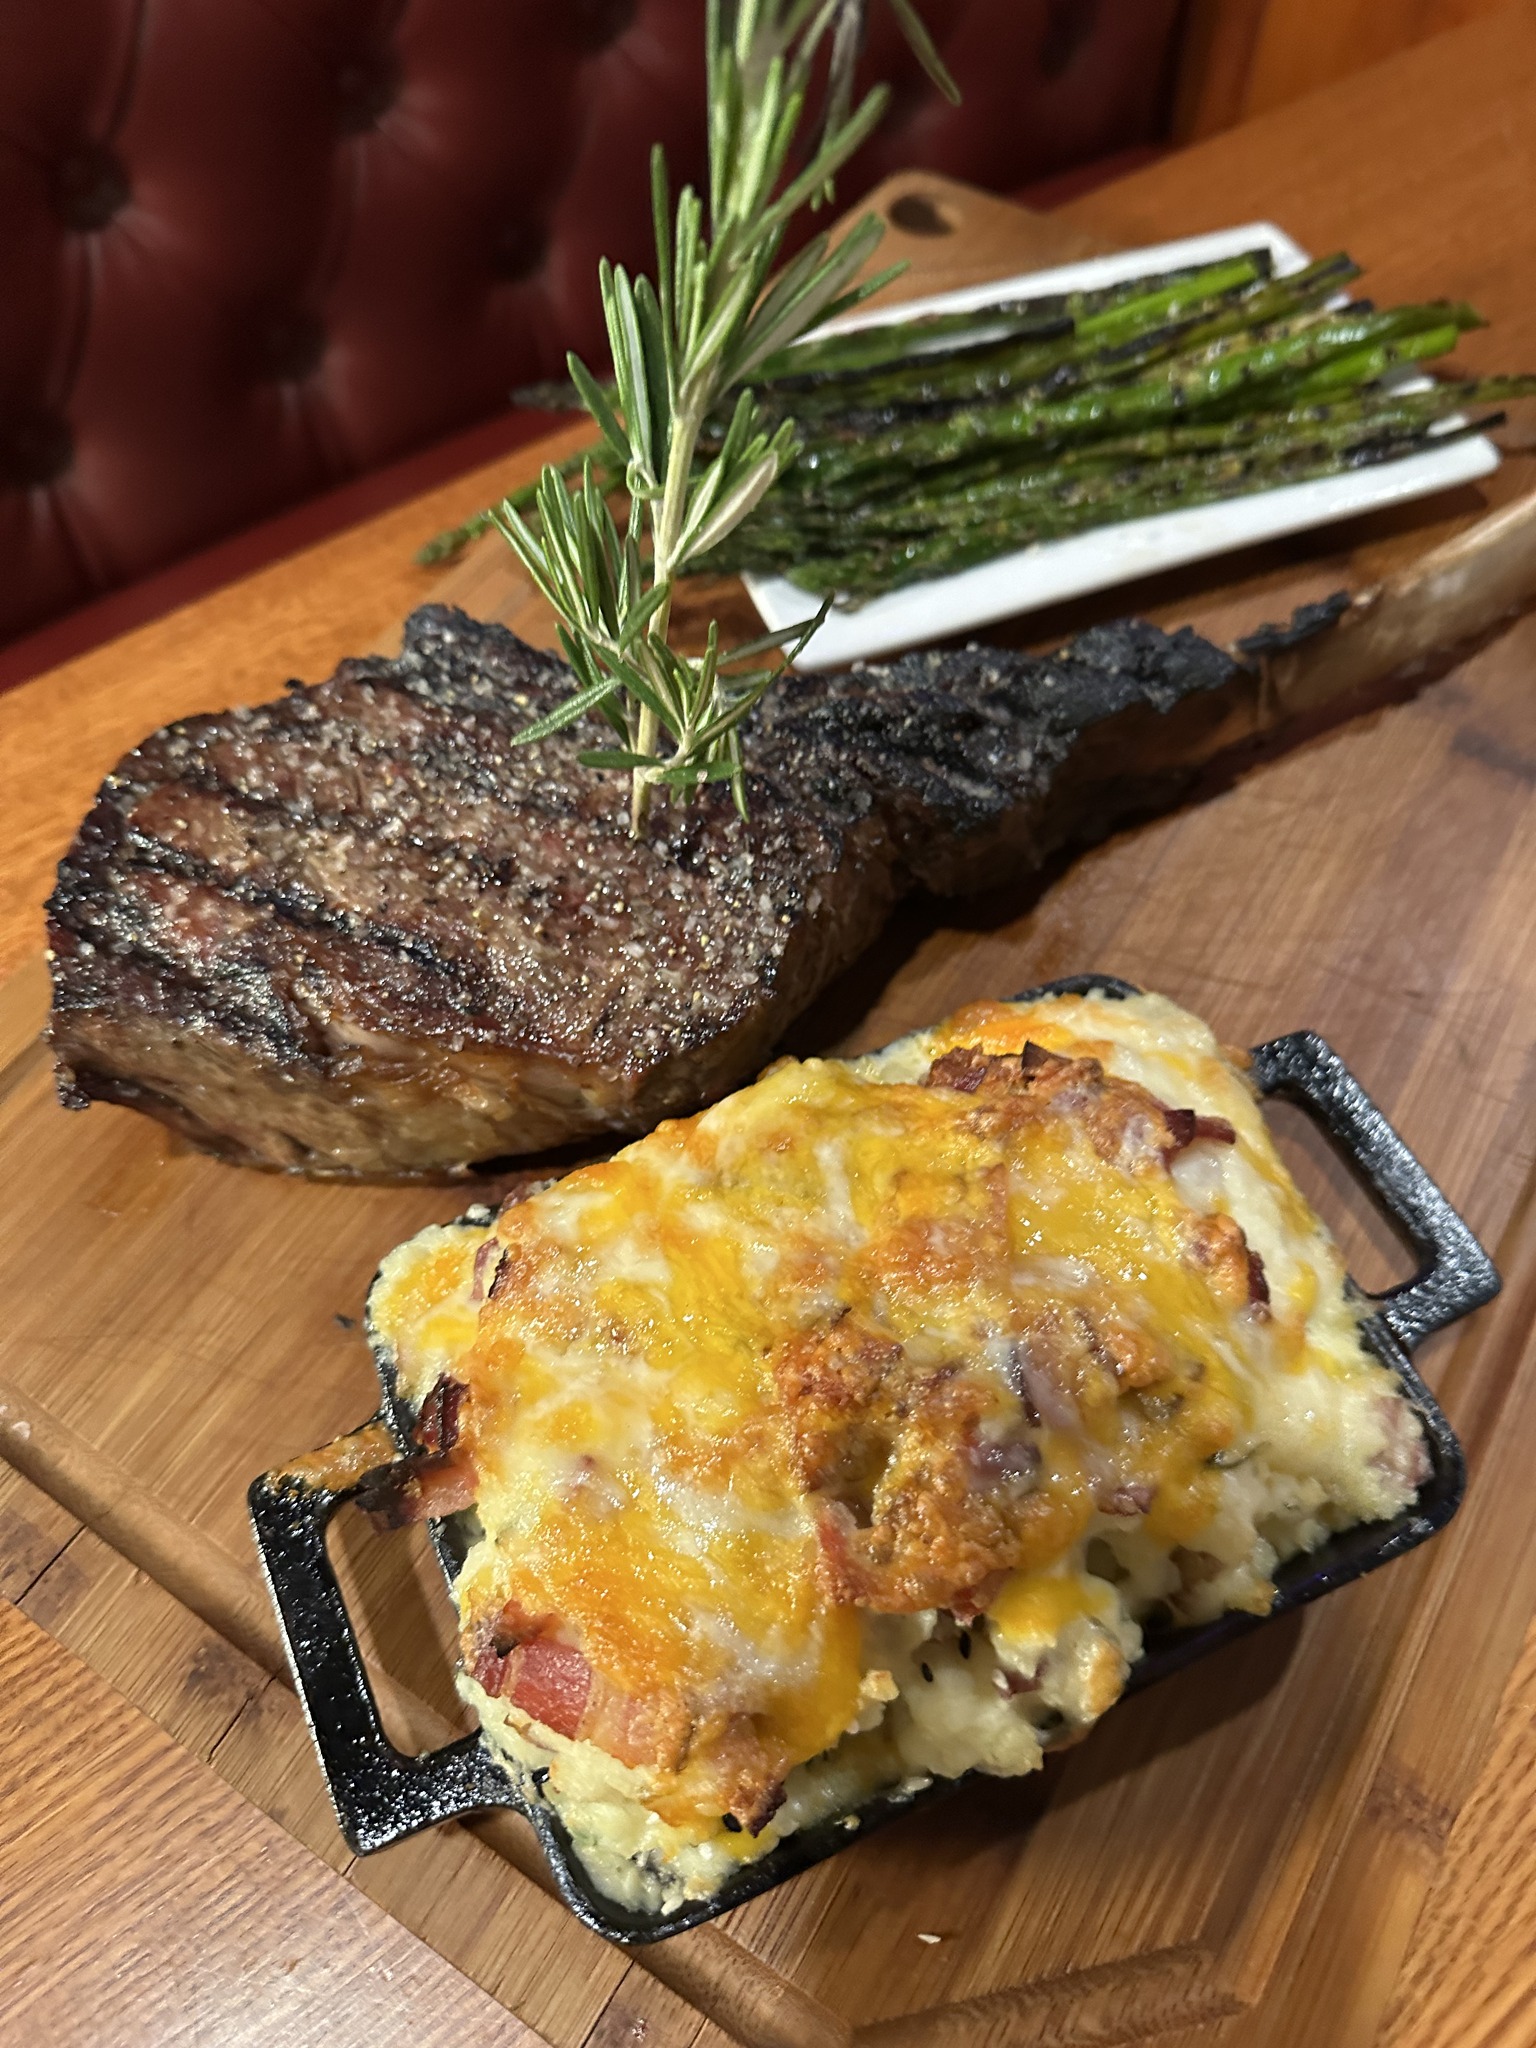
And this all happened with a $15,369 Ad Spend across 3 years using our ABR Customer Acquisition Program.
Step 1 · Attract Attention
Free appetizer. Three years of bringing the regulars back.
Featured Offer
Free Appetizer
One per guest · opt-in requiredA 1-location pub and steakhouse in the Twin Cities exurbs — small-town Minnesota, deep neighborhood roots, and a brand health to back it: 1,236 of 1,312 reviews are 5-star, with a 4.69 rating. The kind of restaurant where regulars come every Friday for years — until life changes their routine and they quietly stop coming. No marketing channel was bringing those lapsed regulars back.
The ask coming into ABR three years ago was direct — build a database the pub owns, run a steady offer that pulls back lapsed regulars, and prove the system compounds over years, not weeks.
So we built the offer around the universal pub starter: a Free Appetizer, redeemable ONLY after a guest joins their marketing program. Three years of running that mechanic captured 9,441 names — including 4,773 birthdays, a marketing asset that drives revenue every day of the year. The offer mechanic doesn't change. What changes is who's now on the list to receive it.
The proof is in the segment mix: 44% of every tracked dollar came from lost regulars brought back, and another 27% came from frequent regulars who kept showing up. The system doesn't just acquire — it sustains the table.
The ads attracted this attention
Over 3 Years.
Step 2 · Build A Database
A Database They Own.
Over 3 Years.
Where that database showed up in sales
73% of tracked sales came from guests who weren't coming back on their own.
First-time guests across three years. Smaller share than acquisition-mode clients — Cornerstone is past launch and into compounding mode.
Lost guests pulled back in. The biggest segment by share AND the headline number for this case. Almost half of three years of tracked sales came from regulars who'd quietly stopped coming — and were brought back.
The already-loyal regulars. Highest absolute dollars of the three segments — premium pub regulars come back consistently year over year and spend the most per visit.
73% of tracked sales came from new guests plus reactivated lost guests. The remaining 27% came from regulars showing up to the offer too. Across three years, that's $235k in tracked sales surfaced by the system — with the lapsed-regular reactivation engine doing the heaviest lift.
Step 3 · Results, Revenue…ROI
The results — and the economics behind them.
Sales & Operations
Over 3 Years.
The ROI
Now the economics: CAC vs LTV
Because marketing isn't for one visit. It's for years of visits.
+ food cost of the promo
(low end — pub & steakhouse regulars come 25+ times/year)
Would you spend $9.20 to earn $2,100?
Plus the ad attention and customer data that come with it? We thought so.
Step 4 · Your Turn
This partner chose our ABR Roadshow & Accelerate Program to get these results.
Click below to schedule a consultation and see if we can help you — and if your restaurant is a great fit for the program.
Photos on this page are for visual reference only. Images may not depict the specific restaurant, location, staff, or menu item referenced in the case study.
Case study metrics reflect actual dashboard reporting from the restaurant referenced. Individual restaurant results vary based on market, concept, offer mechanics, operational execution, timing, and other factors. Past performance is not indicative of future results.
Schedule Your WIN Meeting
Pick a time that works for you.