
$22,896 In Tracked Sales…On Just $1,465 In Ads.
Case Study
A 1-location burrito shop in St. Cloud, Minnesota launched with ABR. In 5 months on $1,465 of ad spend, the program built a 3,444-person opted-in database, drove 1,093 in-store visits, and pulled $22,896 in tracked sales — a 15.6x return on ad spend. Fast-casual concept, fast launch, fast money back. The system pays itself off in weeks, not quarters.
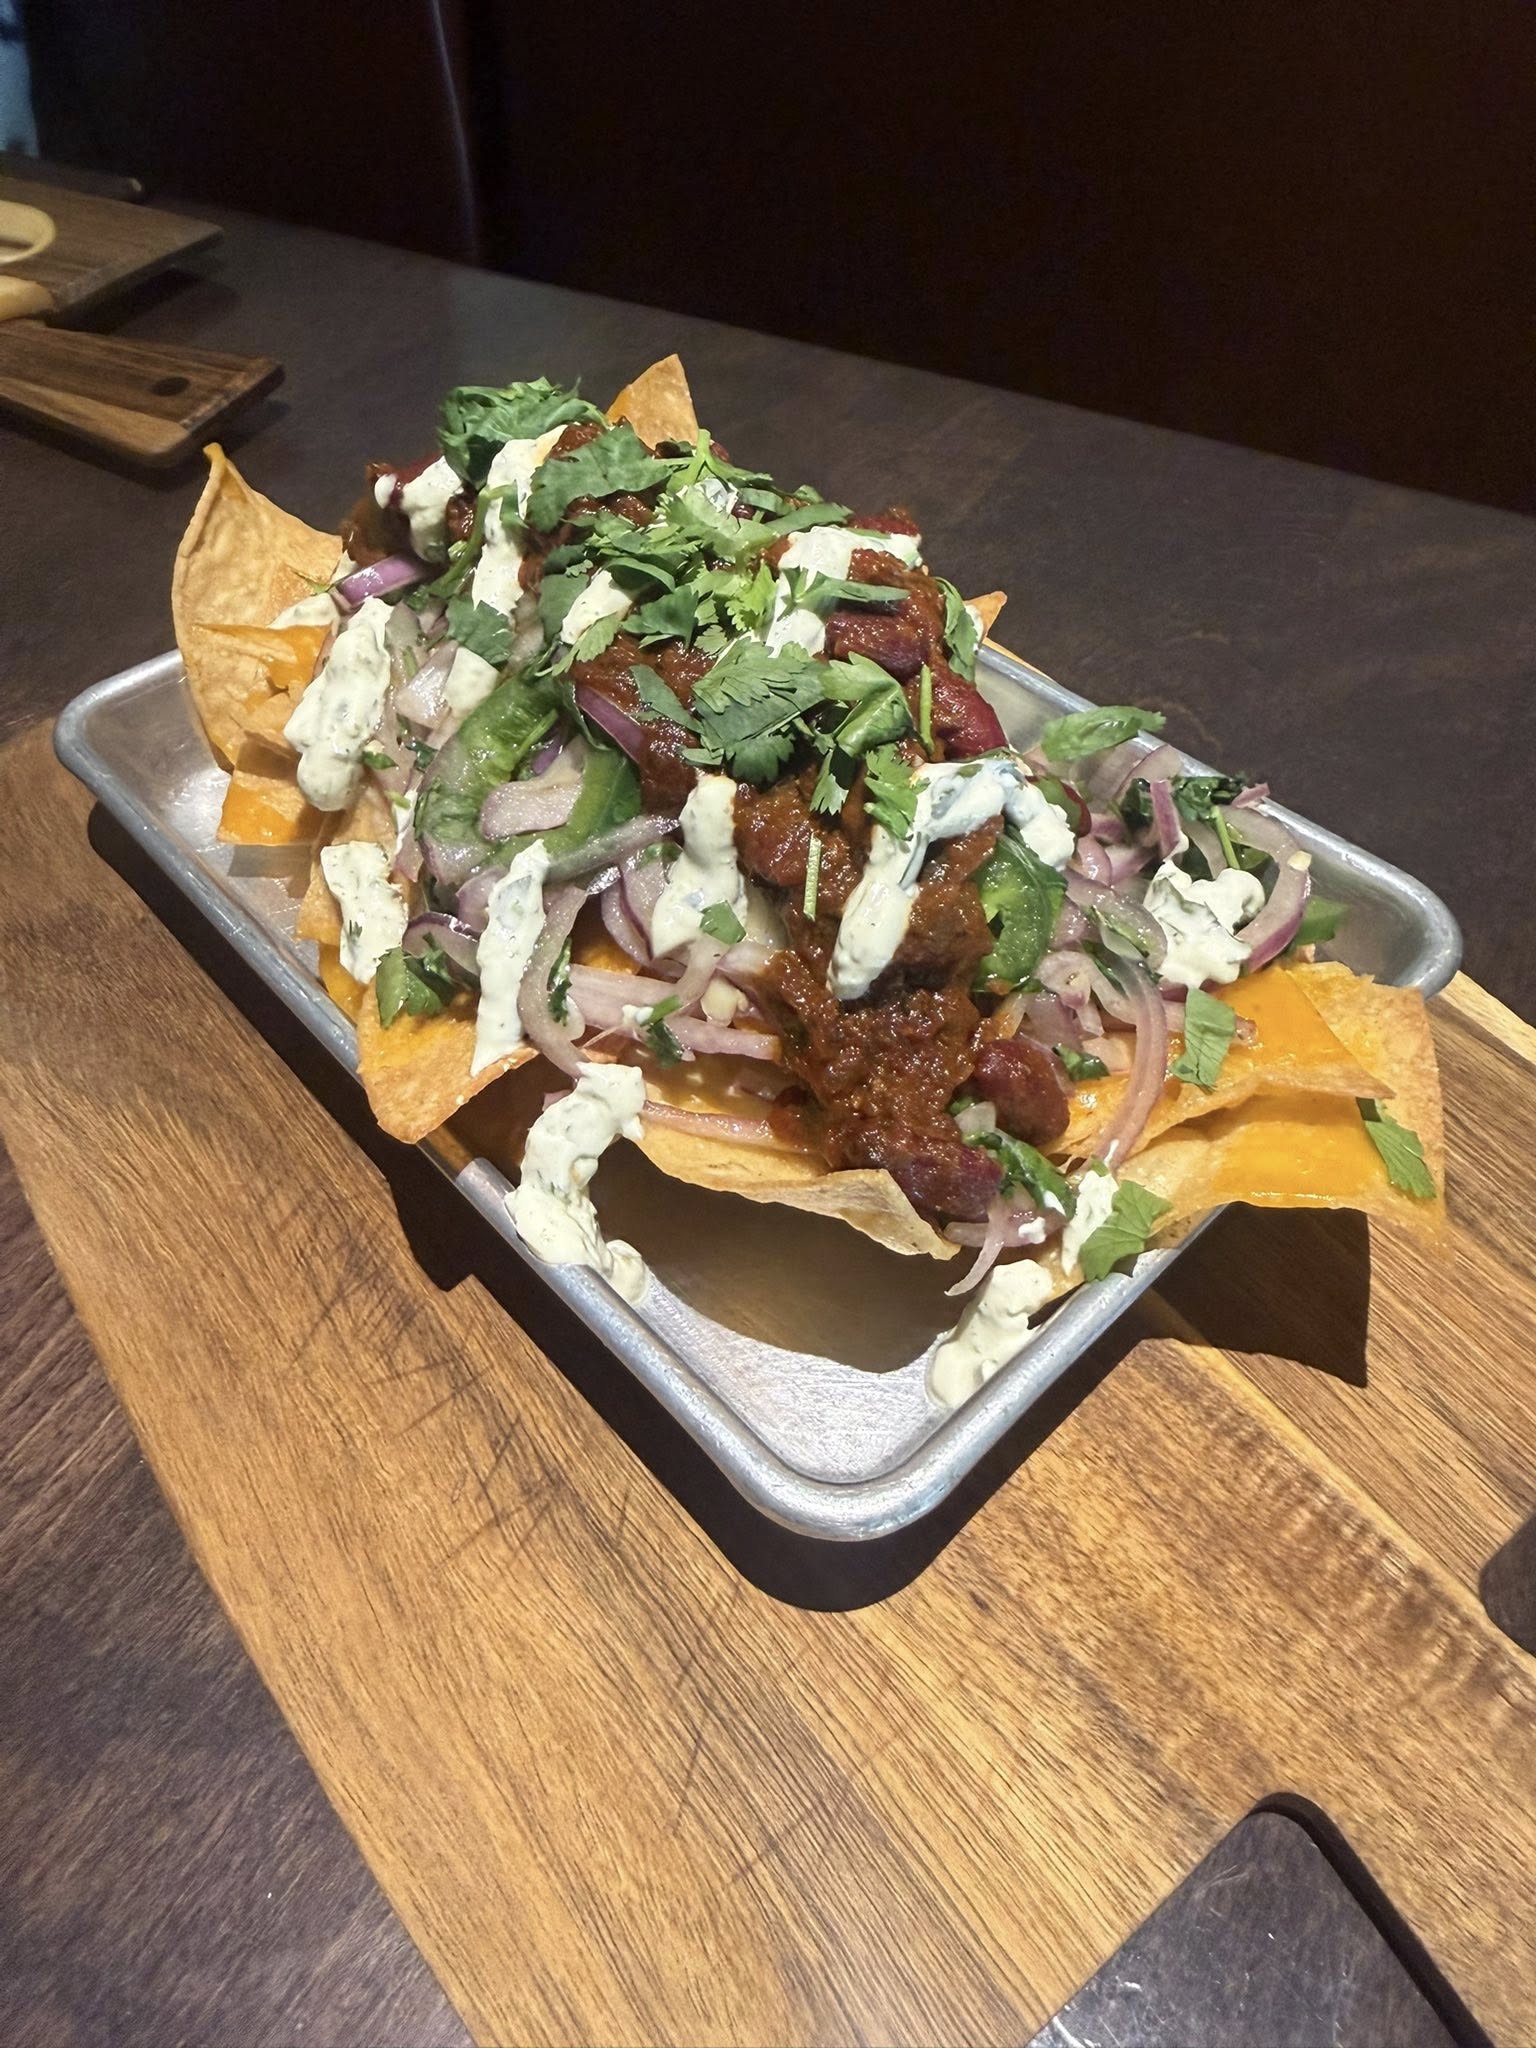
And this all happened with a $1,465 Ad Spend using our ABR Customer Acquisition Program.
Step 1 · Attract Attention
FREE Burrito. Fast-casual. Fast money back.
Featured Offer
FREE Burrito or Bowl
One per guest · opt-in requiredA 1-location burrito shop in St. Cloud, Minnesota. Fast-casual concept — burritos, bowls, quick-service speed. The kind of restaurant where every visit is a transaction, every regular is a rotation, and every dollar of marketing has to pay back fast. Long sales cycles don't fit this business model.
The ask coming into ABR was direct — turn ad attention into immediate visits and immediate sales, while building a database the shop owns for the long run.
So we built the offer around the menu's hero item: a FREE Burrito or Bowl, redeemable ONLY after a guest joins their marketing program. Every opt-in captures a name, email, and phone. Every redemption brings two paying mouths to the counter (the free entree plus the side, drink, second burrito for a friend).
The result speaks to the speed: 1,093 tracked visits and $22,896 in tracked sales in 5 months — at a 15.6x return on ad spend. The fastest payback profile in the early-ramp portfolio.
The ads attracted this attention
In Just 5 Months.
Step 2 · Build A Database
A Database They Own.
In Just 5 Months.
Where that database showed up in sales
75% of tracked sales came from guests who weren't coming back on their own.
First-time guests walking through the door. A third of tracked sales — acquisition is doing its job at fast-casual pace.
Lost guests the offer pulled back in. The biggest segment by share — the BOGO-style FREE Burrito offer pulls back the lapsed regulars who'd drifted out of rotation.
The already-loyal regulars. They came in for the BOGO too — existing-base reinforcement on top of acquisition.
75% of tracked sales came from new guests plus reactivated lost guests — revenue that wasn't showing up without the program. At fast-casual pace, that's $17,000+ in incremental dollars surfaced in 5 months on under $1,500 of ads.
Step 3 · Results, Revenue…ROI
The results — and the economics behind them.
Sales & Operations
In Just 5 Months.
The ROI
Now the economics: CAC vs LTV
Because marketing isn't for one visit. It's for years of visits.
+ food cost of the promo
(low end — fast-casual regulars come 50+ times/year)
Would you spend $6.42 to earn $850?
Plus the ad attention and customer data that come with it? We thought so.
Step 4 · Your Turn
This partner chose our ABR Roadshow & Accelerate Program to get these results.
Click below to schedule a consultation and see if we can help you — and if your restaurant is a great fit for the program.
Photos on this page are for visual reference only. Images may not depict the specific restaurant, location, staff, or menu item referenced in the case study.
Case study metrics reflect actual dashboard reporting from the restaurant referenced. Individual restaurant results vary based on market, concept, offer mechanics, operational execution, timing, and other factors. Past performance is not indicative of future results.
Schedule Your WIN Meeting
Pick a time that works for you.