
$93,013 In Sales From Loyal Regulars…Over 4 Years.
Case Study
A 3-location sports bar concept in West Valley Phoenix launched with ABR over four years ago — the longest-running program in the portfolio. Since then, it's built a 13,169-person opted-in database (the largest database in the entire ABR portfolio, including 7,162 birthdays), driven 5,134 visits across all three locations, and pulled $232,708 in tracked sales at a 10x return. The signature: 40% of every tracked dollar came from loyal frequent regulars — the only client in the portfolio where Frequent customers are the dominant segment. This isn't an acquisition story. It's a community-hangout story.
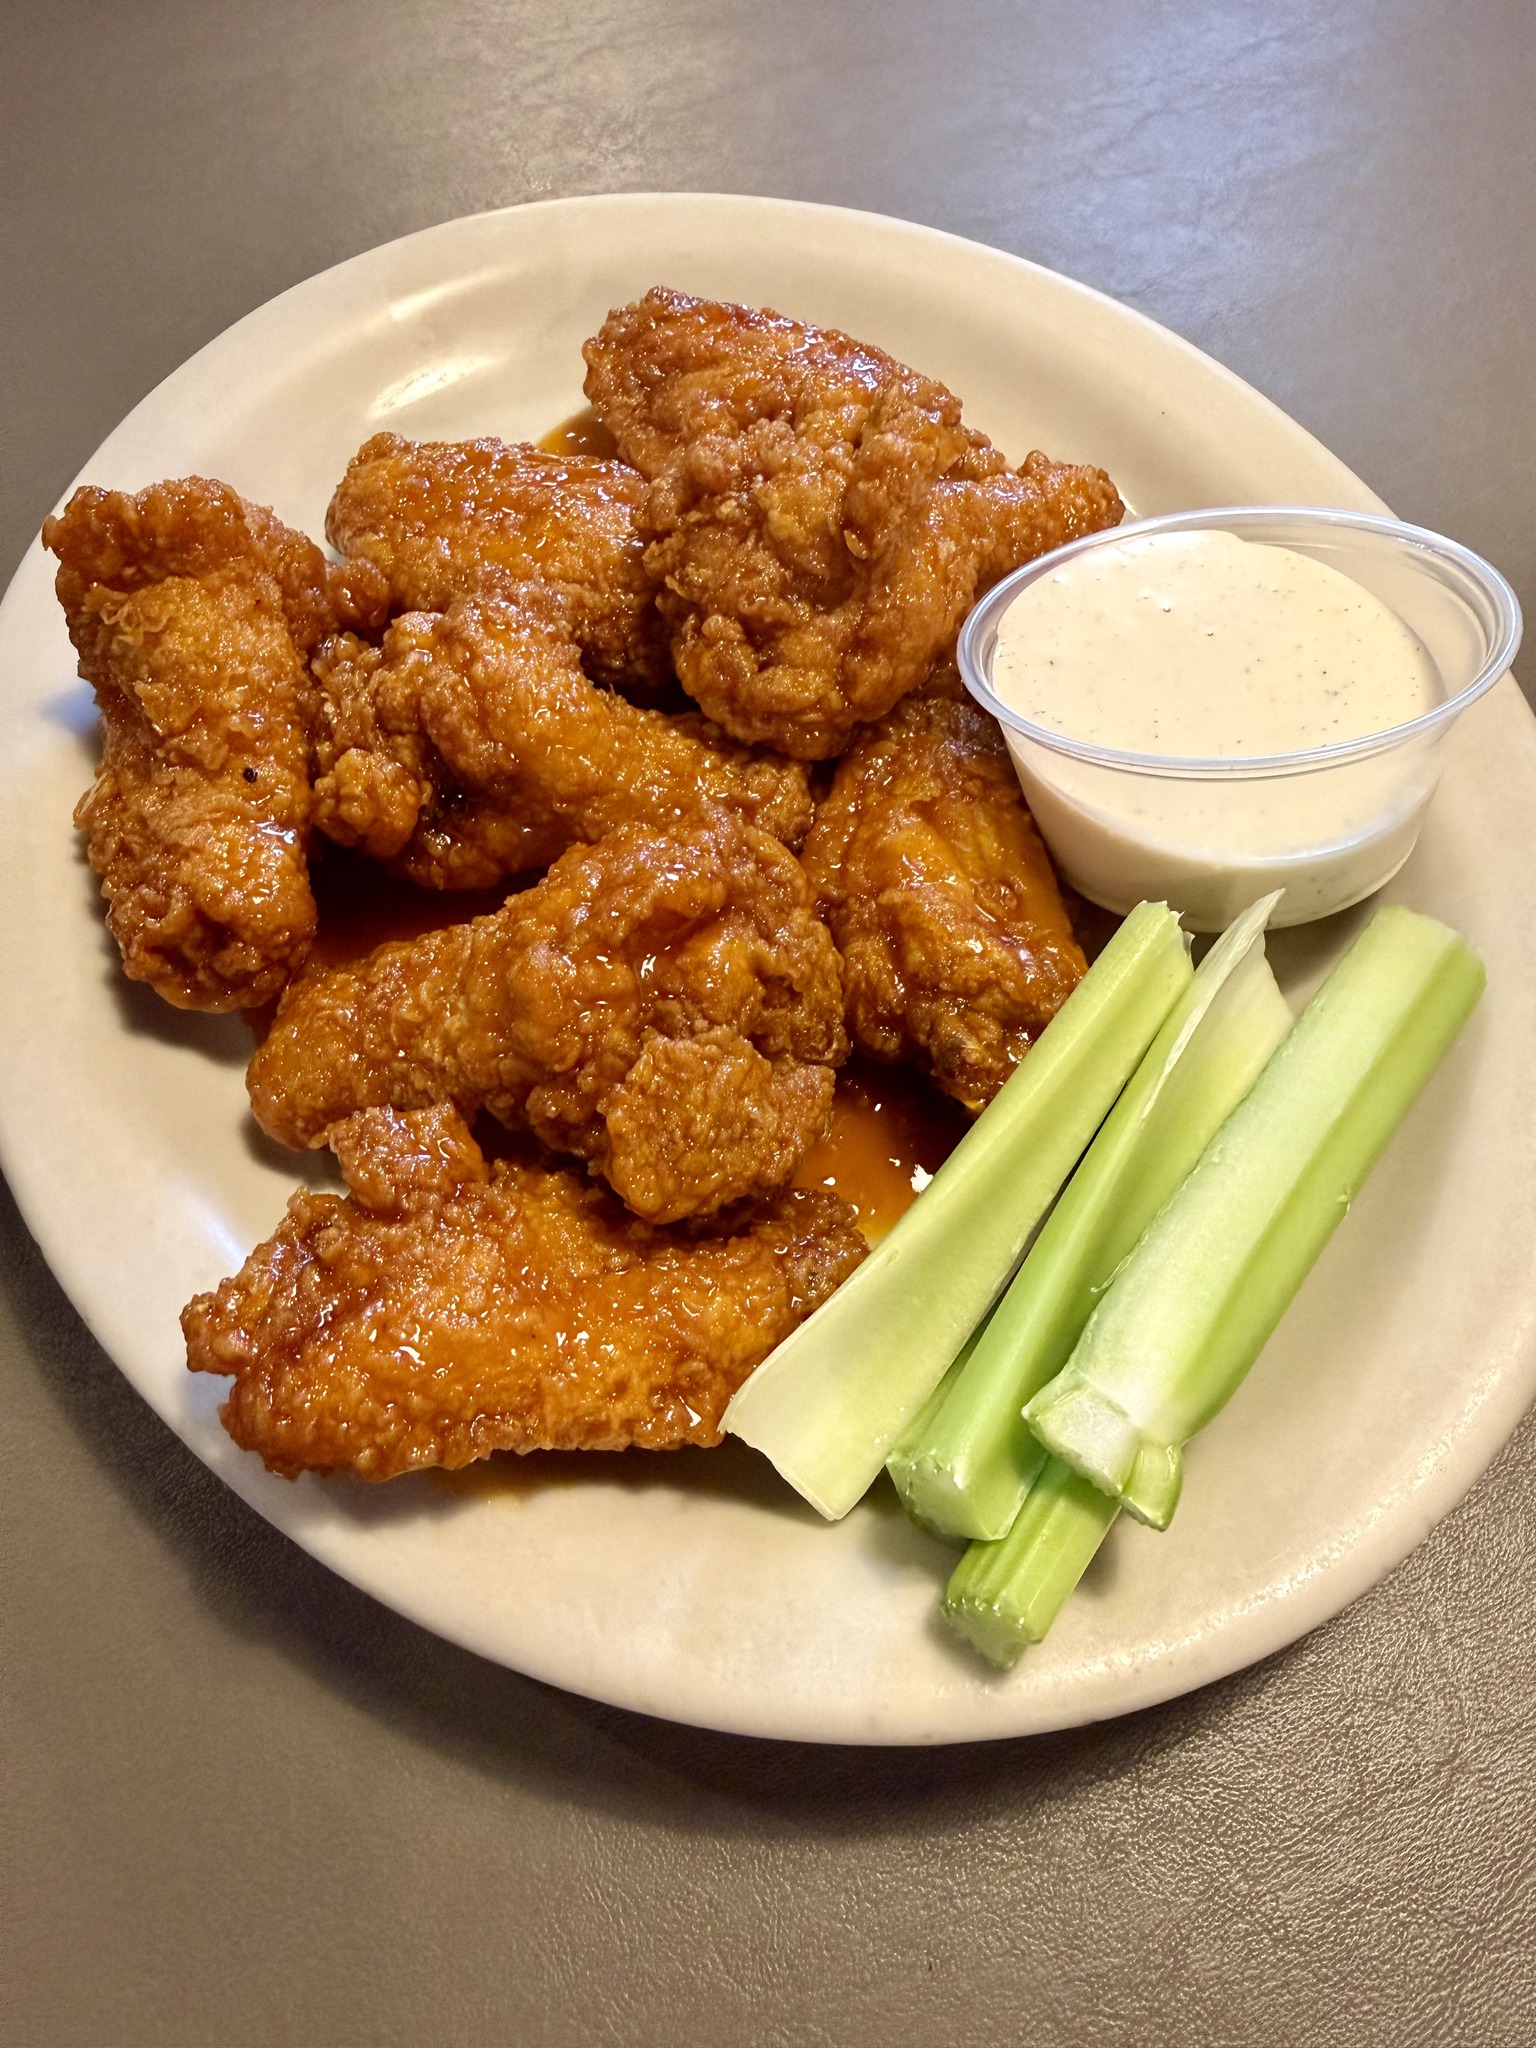
And this all happened with a $23,219 Ad Spend across 4 years using our ABR Customer Acquisition Program.
Step 1 · Attract Attention
Free appetizer. The community keeps coming back.
Featured Offer
Free Appetizer
One per guest · opt-in requiredA 3-location sports bar concept in West Valley Phoenix — wings, burgers, beer, big-screen TVs, and the kind of neighborhood gathering spot where the same people show up every Sunday for the game. Strong reach: 3.1 million ad impressions and 2.7 million unique people reached — the largest audience footprint in the entire ABR portfolio.
The ask coming into ABR over four years ago started simple: build a database the bars own. What evolved was a community hangout marketing system: Messenger Ads driving the database build, Retention Engine flows keeping the regulars engaged, organic Facebook posts converting at near-1:1 redemption rates, and Birthday Offers running every day of the year off the largest birthday database in the portfolio (7,162 captures).
The offer at the center is a Free Appetizer, redeemable ONLY after a guest joins their marketing program. Four years of running that mechanic across all three units captured 13,169 names — but the more interesting number is what happens AFTER a guest joins. They come back. Booty's is the only client in the portfolio where Frequent regulars are the dominant sales segment.
The proof: $93,013 of the $232,708 lifetime tracked sales came from loyal frequent regulars (40%). Plus $84,593 from new customers who turned into regulars themselves over time. The system isn't acquiring strangers anymore. It's reinforcing a community that already shows up.
The ads attracted this attention
Over 4 Years.
Step 2 · Build A Database
A Database They Own.
Over 4 Years.
Where that database showed up in sales
60% of tracked sales came from new and reactivated guests — and 40% came from regulars who keep showing up.
First-time guests across four years. Solid acquisition share, but secondary to the loyal-regular engine driving this program.
Lost guests pulled back in. Smaller share than peer 4-year clients — Booty's customers don't lapse as often, because they're already in the rotation.
The dominant segment. The only client in the entire ABR portfolio where Frequent regulars are the largest piece of the pie. Same people, every game night, four years running.
60% of tracked sales came from new guests plus reactivated lost guests — the standard "Found Money" the system surfaces. But the OTHER 40% is the more interesting number here: it's regulars who keep showing up. That's not Found Money — that's the system reinforcing a community hangout, four years deep.
Step 3 · Results, Revenue…ROI
The results — and the economics behind them.
Sales & Operations
Over 4 Years.
The ROI
Now the economics: CAC vs LTV
Because marketing isn't for one visit. It's for years of visits.
+ food cost of the promo
(low end — sports bar regulars come weekly for years)
Would you spend $12.03 to earn $1,800?
Plus the ad attention and customer data that come with it? We thought so.
Step 4 · Your Turn
This partner chose our ABR Roadshow & Accelerate Program to get these results.
Click below to schedule a consultation and see if we can help you — and if your restaurant is a great fit for the program.
Photos on this page are for visual reference only. Images may not depict the specific restaurant, location, staff, or menu item referenced in the case study.
Case study metrics reflect actual dashboard reporting from the restaurant referenced. Individual restaurant results vary based on market, concept, offer mechanics, operational execution, timing, and other factors. Past performance is not indicative of future results.
Schedule Your WIN Meeting
Pick a time that works for you.