
$294,868 In Tracked Sales. 11,848 Opt-Ins…Over 4 Years.
Case Study
A 1-location neighborhood pub in Bucks County, Pennsylvania launched with ABR over four years ago — the longest-running program in the portfolio. Since then, it's built an 11,848-person opted-in database (6,723 birthdays included), driven 4,633 visits, and pulled $294,868 in tracked sales at a $63.65 average check and 13.57x return on ad spend. The signature: 17 distinct opt-in channels — Messenger Ads, website pop-up, Beer List signage, QR codes, organic Facebook posts, VIP referral videos, and more. The most complete acquisition system in the entire ABR portfolio. Four years of full-stack.
And this all happened with a $21,725 Ad Spend across 4 years using our ABR Customer Acquisition Program.
Step 1 · Attract Attention
17 acquisition channels. The complete system.
Featured Offer
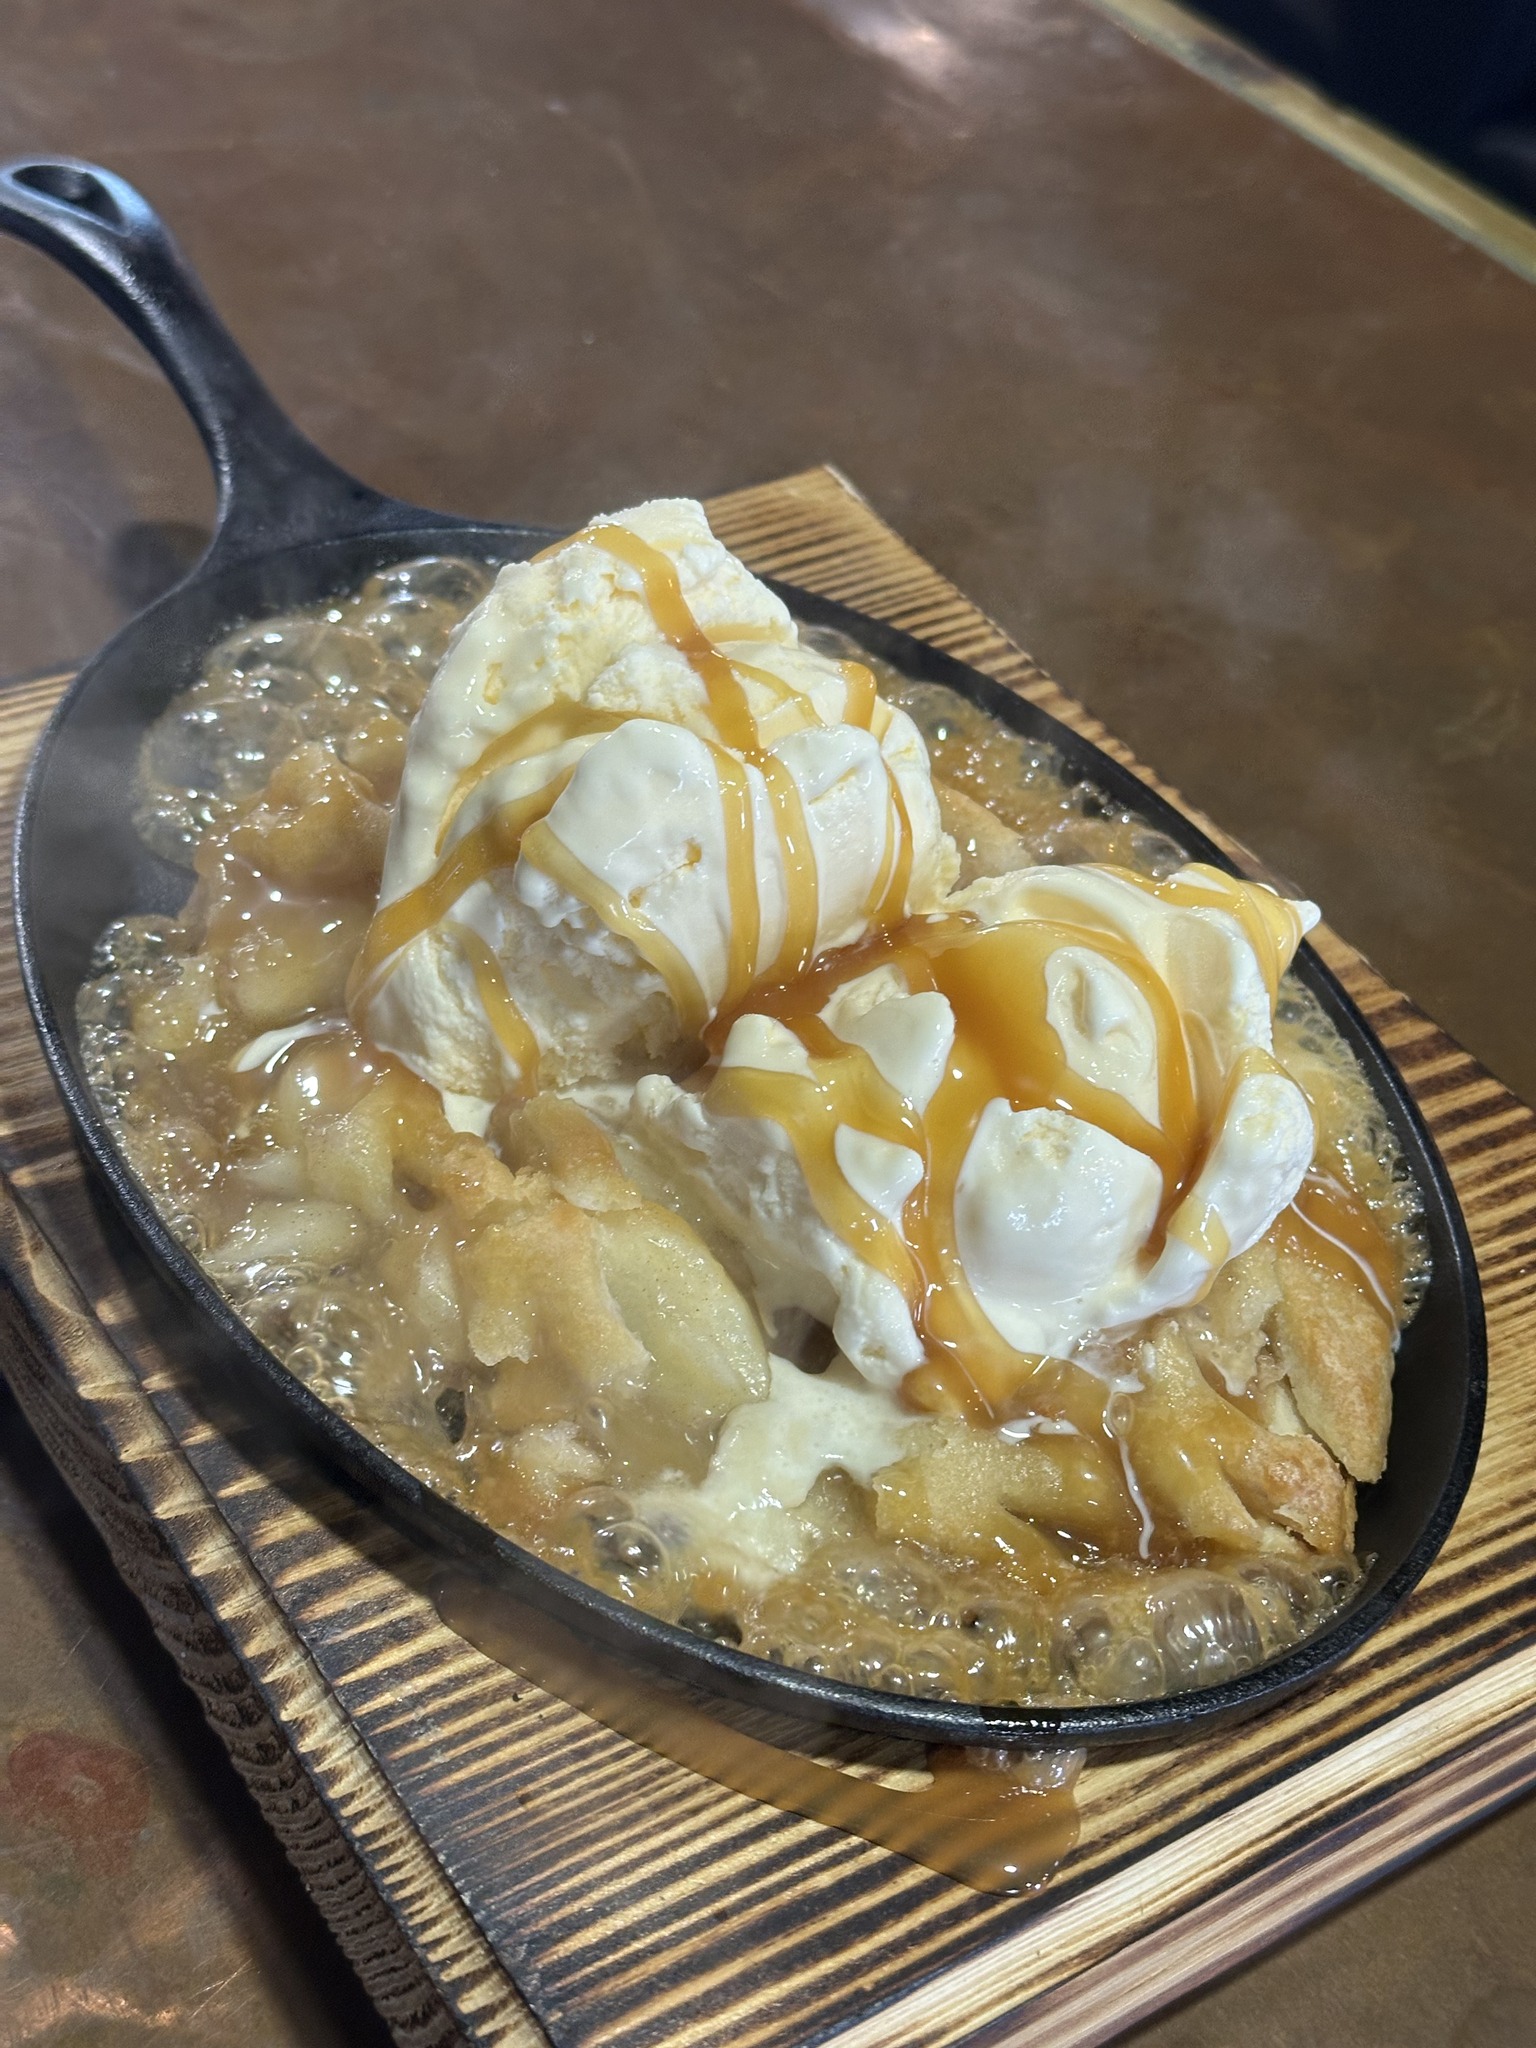
Free Dessert
One per guest · opt-in requiredA 1-location neighborhood pub in Bucks County, Pennsylvania. The kind of small-town pub where the regulars are family, the beer list is a love letter, and four years of consistent marketing have produced the most sophisticated acquisition system in the entire ABR portfolio.
The ask coming into ABR over four years ago started simple — build a database the pub owns. What it became, year over year, was a 17-channel acquisition stack: Messenger Ads (6,940 opt-ins), website pop-ups, an embedded mailing list, in-store Beer List signage, QR codes on monthly menus, organic Facebook posts (highest-converting source — 68.6% redemption), VIP referral videos, and 10 more. Every touchpoint with a customer became a path into the database.
The featured offer evolved with the system: a Free Dessert, redeemable ONLY after a guest joins their marketing program. Four years of running that mechanic captured 11,848 names — including 6,723 birthdays, the second-largest birthday database in the portfolio. The Birthday Offer alone is now a recurring revenue engine, every single day of the year.
The proof is the cumulative number: $294,868 in tracked sales over four years at 13.57x return on ad spend — and the dashboard projects $1.3M in annual impact from the database moving forward. Four years in, the system is still acquiring NEW customers at 42% share. Most mature programs see acquisition decline. Perkasie's keeps finding new audiences.
The ads attracted this attention
Over 4 Years.
Step 2 · Build A Database
A Database They Own.
Over 4 Years.
Where that database showed up in sales
71% of tracked sales came from guests who weren't coming back on their own.
First-time guests across four years of compounding. Largest segment by share — rare for a 4-year program. The system keeps finding new audiences year after year.
Lost guests pulled back in over four years. The retention engine working in parallel with acquisition — nearly $77k in sales from regulars who'd drifted out and were brought back.
The already-loyal regulars. Highest absolute dollars across the three segments — pub regulars come back consistently, year over year, and the system rewards them with offers (Free Dessert, Birthday Offer) that compound the relationship.
71% of tracked sales came from new guests plus reactivated lost guests. The remaining 29% came from regulars showing up to the offer too. Across four years, that's $295k in tracked sales — with the dashboard projecting $1.3M in annual impact from the active database moving forward.
Step 3 · Results, Revenue…ROI
The results — and the economics behind them.
Sales & Operations
Over 4 Years.
The ROI
Now the economics: CAC vs LTV
Because marketing isn't for one visit. It's for years of visits.
+ food cost of the promo
(low end — pub regulars come 25+ times/year for years)
Would you spend $11.49 to earn $2,500?
Plus the ad attention and customer data that come with it? We thought so.
Step 4 · Your Turn
This partner chose our ABR Roadshow & Accelerate Program to get these results.
Click below to schedule a consultation and see if we can help you — and if your restaurant is a great fit for the program.
Photos on this page are for visual reference only. Images may not depict the specific restaurant, location, staff, or menu item referenced in the case study.
Case study metrics reflect actual dashboard reporting from the restaurant referenced. Individual restaurant results vary based on market, concept, offer mechanics, operational execution, timing, and other factors. Past performance is not indicative of future results.
Schedule Your WIN Meeting
Pick a time that works for you.